 On Tuesday, the Associated Builders and Contractors (ABC) held a webinar for the media called the 2012 Mid-Year Construction Forecast with presentations from some of the most powerful industry-related economists with fresh data and forecasts…and some surprises.
See new construction data and the latest trends it suggests will occur…
strata-GEE.com participated in the ABC event which contained a lot of new data and a fascinating Q&A segment in which the interaction between the various economists in answering questions – including one we asked – often uncovered some new insights into trends. Participating in this event were Michael Bellaman, President and CEO of Associated Builders and Contractors; Kermit Baker, Chief Economist for the American Institute of Architects; David Crowe, Chief Economist, National Association of Home Builders; and Anirban Basu, Chief Economist of the Associated Builders and Contractors.
Each economist had a defined presentation of about ten minutes in length covering some aspect of the construction industry – Baker covered design activity for mostly non-residential construction, Crowe covered residential construction and remodeling, and Basu covered mostly commercial/industrial construction.
Architects and ‘design activity’ in the economy…
Kermit Baker started his presentation discussing the “disappointing recovery” which is taking far too long to unfold. The factors complicating recovery include: declining home prices in some markets, mortgages “under water,” and delinquencies/foreclosures still remaining too high. Adding to these factors are tight credit, weak job growth, an uncertain economic and political climate, and volatile energy prices.
On the plus side, corporate profits are at pre-recession levels, consumer sentiment is trending up, construction market fundamentals are improving, and the Architecture Billings Index is trending up indicating increased design activity.
The surprising shift to rental households…
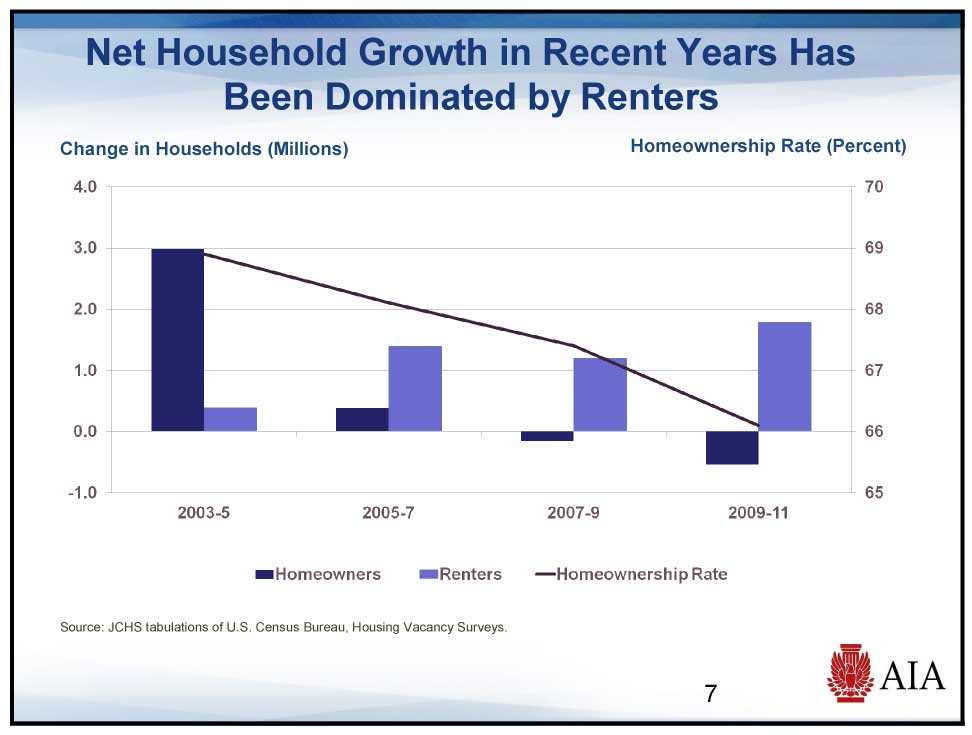
Often the economists covered the same or similar ground. And certainly that was the case with a trend first identified by the AIA economist…there has been a dramatic shift in the number of households being formed by renters. That’s right, the rate of home ownership is declining – on his chart from 69% to 66%. And, Baker told us, in the first quarter of 2012, it dropped again to 65.4% – the lowest rate of home ownership since 1997. The NAHB economist would also note the “rise of the renter.”
Baker also noted that the home improvement market was showing remarkable resilience. Although down from its high of $326 billion in 2007…it appears to be trending to about $300 billion this year and has been relatively stable since 2008. Of the total of home improvement expenditures, about 80% is by Owner/Occupied homes.
AIA’s ABI…
Baker then showed an interesting graph called the AIA Architecture Billings Index. This Index is built from a monthly survey of architecture firms and is designed to gauge the level of design activity. Design activity, Baker tells us, is a leading indicator of construction activity by a period of about 9 months-to-1 year of time.
The Index was plotted by construction segment: Commercial/Industrial – office, retail, hotel, manufacturing, distribution; Residential – which Baker said was heavily weighted to multifamily; and Institutional – healthcare, education, government, cultural.
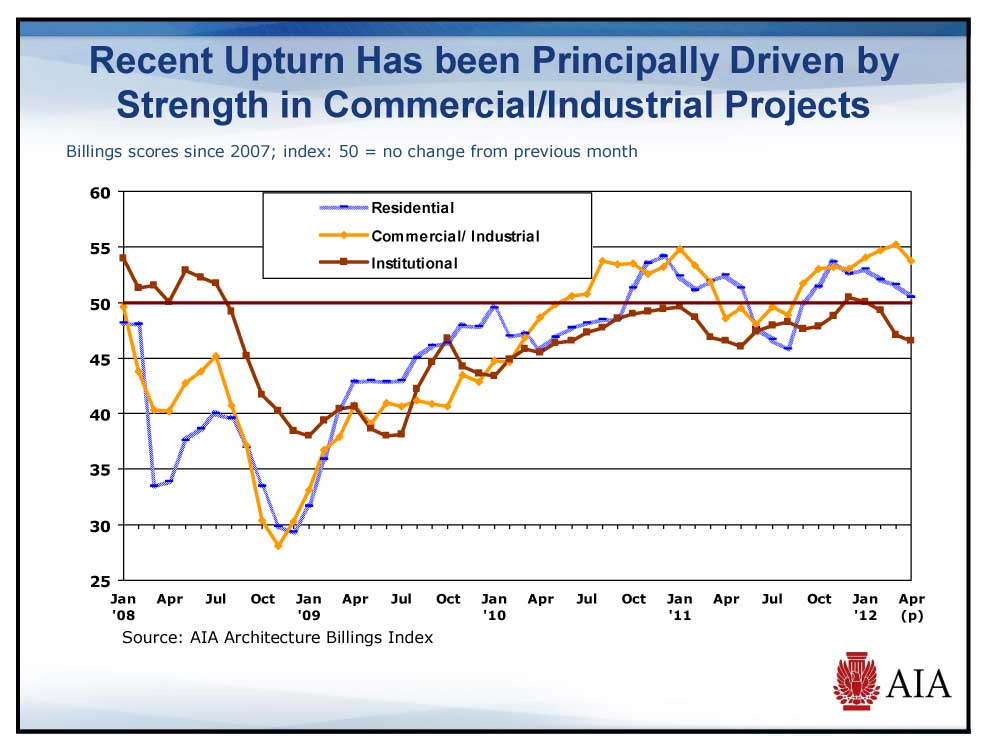 In looking at the Index – any rating above 50 indicated a growth in design activity, and any rating below 50 would indicate a decline in design activity. While the Institutional segment “remains a very weak market” – it was easy to see that Commercial/Industrial was the strongest segment. “We’ve seen very strong numbers in that sector,” Baker told reporters.
As if to hammer that point home, Baker then showed a forecast by segment for 2012 and 2013. Commercial and Industrial segments both showed mid-single digit growth for 2012 and double-digit growth for 2013. However, the AIA is forecasting all segments to grow in 2013.
NAHB’s Crowe, builds his case…
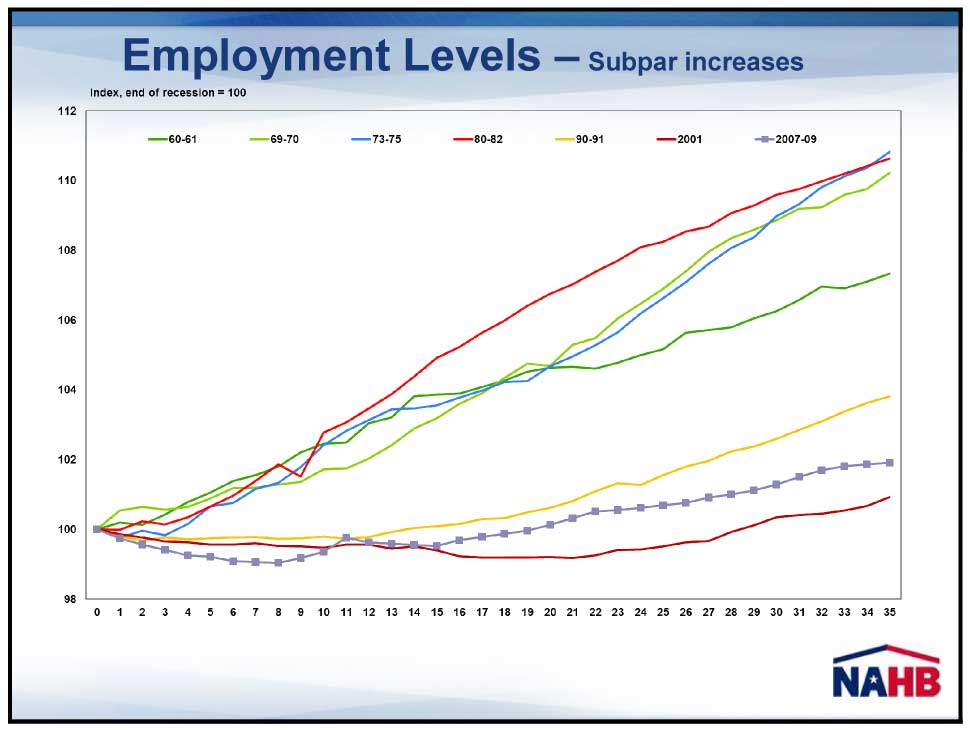
David Crowe, the NAHB’s Chief Economist, took over at this point and like Baker, he started by discussing the sluggish recovery. “Real GDP” Crowe says is muddling along at about a 2% pace. The culprit? Slow job growth. Crowe showed a chart comparing the various rates of recovery from 7 different recessionary periods. In a surprise, the current recovery was the second slowest – not the worst – beaten out for that title by the recovery from the recession of 2001.
 However, the NAHB seemed to be the most optimistic of all of the economists showing several forecasts of growth in home sales, single-family starts, multifamily starts, and residential remodeling – all beginning in 2012 and accelerating in 2013 (except multifamily growth rate will decline a little). And while that’s encouraging, even the ABC economist cautioned against too much optimism for 2013.
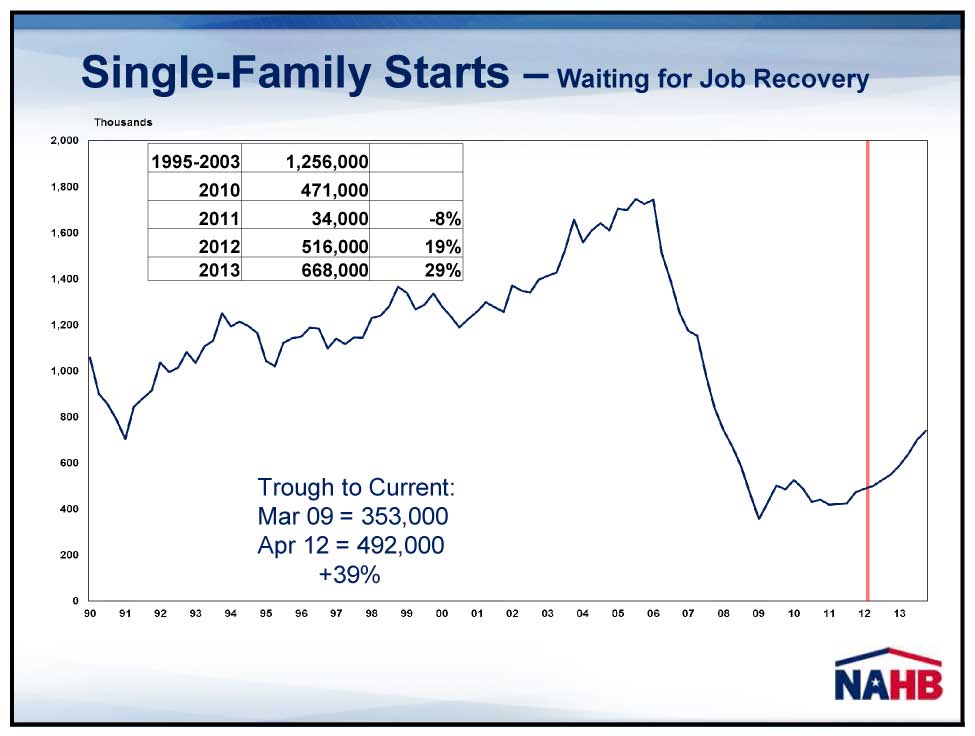
While single-family starts are expected to rebound, they are still well below their peak…or their normal level. However, Crowe was more optimistic about residential remodeling which he predicts will reach its “normal” level in 2013.
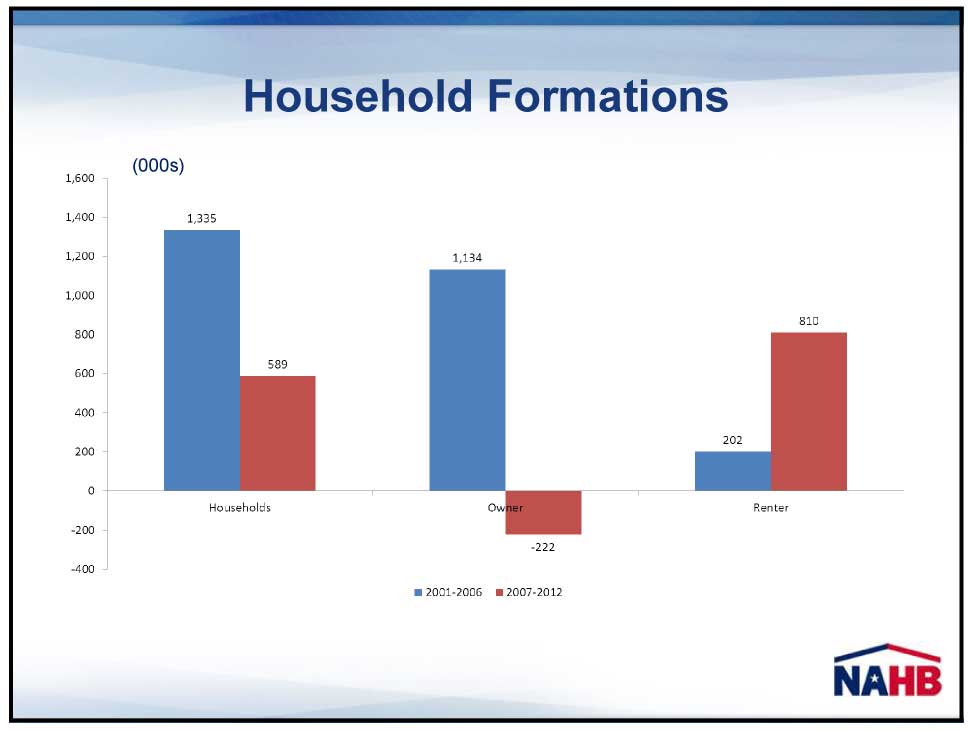
Picking up on a comment by Baker, Crowe also noted the “extraordinary growth in rentals” as part of total household formations. Showing a graph comparing the breakdown of household formation between the recession of 2001-2006 and 2007-2012, it was clear to see the surprisingly high rate of growth in the percentage of household formations by renters.
 But Crowe also focused on what he called “an important component in the recovery” especially as it relates to different parts of the country experiencing a different level of recovery. Crowe showed a graph which broke down the “delinquency inventory” by state. This inventory refers specifically to homes with mortgages 90 days or more late and/or in foreclosure.
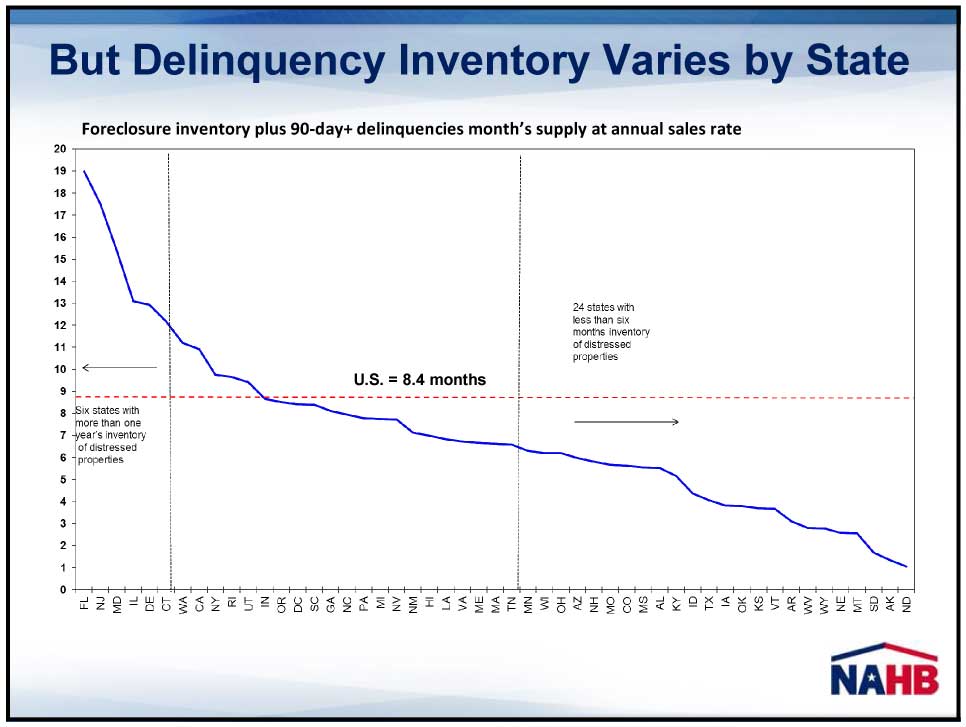 According to Crowe’s chart, the national average for the level of distressed inventory is at 8.4 months. But the variance by state was huge – from 1 month’s inventory for North Dakota to 19 month’s inventory for Florida. With more than a year-and-a-half of delinquency inventory, Florida just isn’t going to recover as quickly as North Dakota.
Basu discusses the A,B,Cs of nonresidential construction…
Anirban Basu, Chief Economist for ABC, discussed several elements of the industrial/commercial construction segment. Like the others, Basu discussed the sluggish job growth situation in detail. Job growth is decelerating, Basu told reporters. And this is not only bad for demand, it also erodes confidence in investors to risk their capital on construction projects.
The construction segment has lost 2 million jobs since 2007. And even though we’re in our third year of recovery, construction has only added 18,000 jobs in the last year…an amount that statistically is not meaningful.
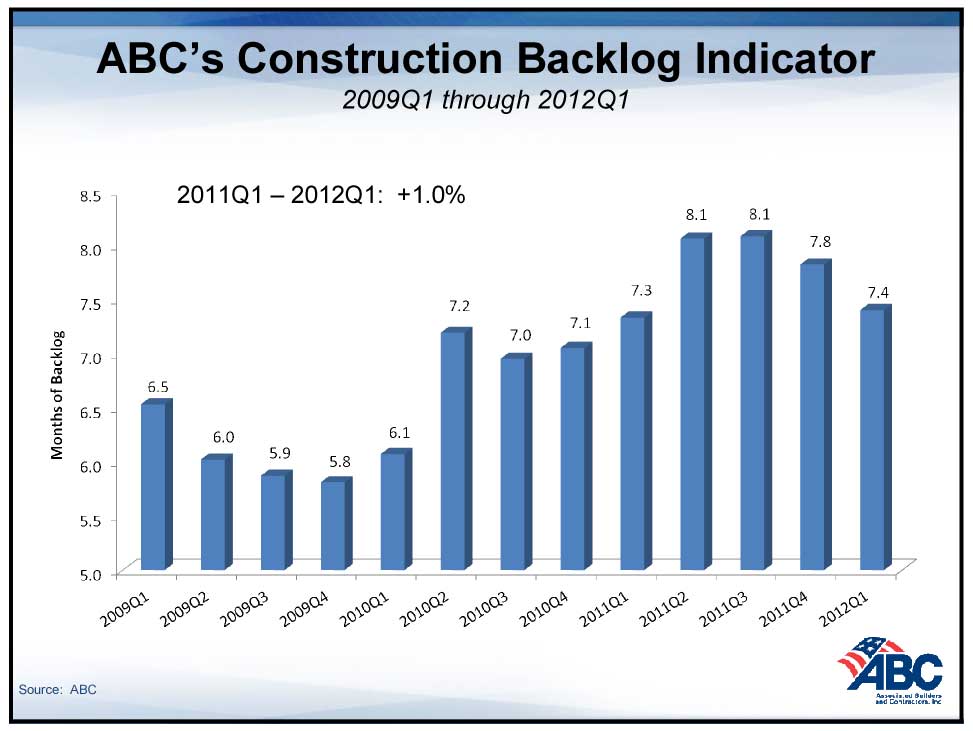
Basu then showed a tracking chart that the ABC uses called the Construction Backlog Indicator. This chart shows, in number of months, the amount of work currently under contract by construction companies. Of particular concern to the ABC is that this indicator has been declining for the last three consecutive quarters.
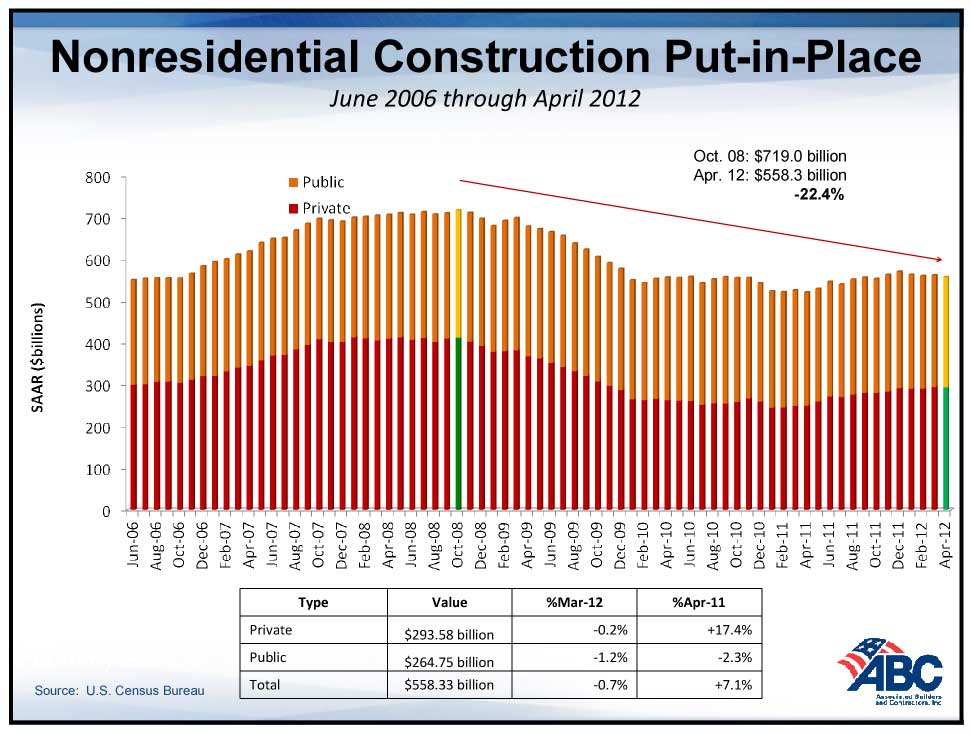
 The ABC economist then showed a chart of nonresidential construction activity from June 2006 through April 2012. As you might suspect, it shows a decided downward trend with total activity declining by 22.4% over this time period.
 Basu, unlike the other economists, did not show any forecasts of future activity. Rather, he used his time to describe the totality of the situation as it exists now. In summation, Basu says that “capital remains too scared.” There is too much uncertainty about the situation in Europe, the election, taxation, debt ceiling, healthcare and job creation for risk-seeking capital to drive construction.
Q&A session drew animated answers…
In a series of questions, the economists often combined to offer detailed feedback addressing the questioner’s query. We were fortunate to have our question served up to the panel. Our question was:
Do you expect the trend of a lower rate of home ownership and higher level of rental activity (in household formation) to continue for the foreseeable future?
David Crowe jumped on it immediately with a rapid-fire response:
Yeah, I do. I think the repair to credit for young people who are typically the major “adds” to the home ownership rate – their inability to join the workforce – the tighter credit standards – and the availability of rental property – makes it easier and more likely that the additional net to the household formations will most likely be renters.
I don’t think that’s permanent, however. I don’t think we’ve shifted to a new paradigm. I think we simply are in a very long cycle of individual credit repair and household net worth rebuilding and once those occur, I think we’ll begin to see those households that first became renters will drift into home ownership.
But we’re probably four or five – or more – years away from that.
Kermit Baker also jumped in on our question adding:
I’d like to get in on this to – you know – reinforce David’s point. I think there’s a lot of survey work out there – Fannie Mae and others have done some – that have asked young households/renters if they intend to buy at some point in the future. And the answer is an overwhelming ‘yes!’
So I think we will get back to normal. As David said, we’re not in a New World out there – a new paradigm. It’s just a matter of getting the floor under our feet before households get back to a more traditional behavior.


Leave a Reply