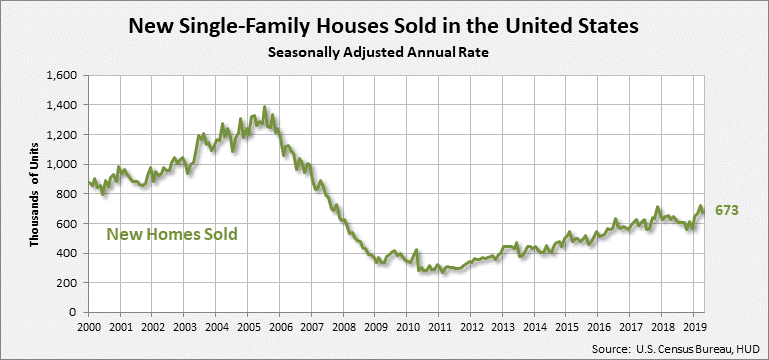
The latest data from the Census Bureau shows that sales of new single-family housing in April dropped to a rate of 673,000 on a seasonally adjusted annual basis. This level is down a substantial 6.9% from the adjusted rate for March of 723,000 houses sold.
See more on this drop in sales of new housing
It should be noted that the rate in March was a surprising upgrade, and that rate of 723,000 homes sold was an 11-year high for the month of March. And while April’s decline of 6.9% was disappointing, the 673,000 homes sold still was 7% higher than the 629,000 homes sold in the month a year earlier.
However, the 6.9% drop caught many off-guard. According to a poll of economists by the Wall Street Journal, a decline was expected, but only at a more modest rate of -2.7%…not 6.9%.
Some residential market analysts are suggesting that the March and April figures should be combined to get a clearer picture on the residential market. Looking at it this way, they feel bullish that sales in the new home market are improving…if not great.

Home Builders Struck a Cautionary Tone
Still, the National Association of Home Builders (NAHB) struck a cautionary tone in a newsletter to their members recently, noting that housing affordability is about the same now as it was a year ago – even though mortgage rates have come down substantially since then. However, those mortgage rate declines, which normally improve home affordability, was offset largely due to home construction costs continuing to rise, driving up home prices.
According to the NAHB/Wells Fargo Housing Opportunity Index, only 61% of new and existing homes for sale in April were affordable to the average American household. The group also notes that for the last five consecutive quarters, residential housing made a “negative contribution” to economic growth – a bit of a warning sign as housing is a significant economic driver.

Regionally, Only the Northeast Increased Sales vs March
On a regional basis, April sales of new single-family homes declined in all regions with the exception of the Northeast which registered an 11.5% increase over March. But even this number was 12.1% lower than the rate of sales in April 2018 in the Northeast.
Conversely, all other regions showed declines of 7.4%, 7.3%, and 8.3% respectively as compared to March for the Midwest, South, and West regions. Yet each of these other regions showed increases over the same month last year of 3.6%, 5.1%, and 16.8 respectively.
A Significant Increase in Home Prices
Much as the NAHB warned on the issue of affordability, this latest survey showed that both the median and average prices for new homes saw big increases, coming in at $342,200 and $393,700 respectively. The median level is the highest we could find in data going back more than a year, and the average is the highest level it’s been since October 2018.


Leave a Reply