Two different economic reports on the residential housing market show conflicting results. One report is on the latest data in housing starts…the other contains the latest results on new home sales. But these reports paint two very different pictures. Is housing growing? Or rather, is it fading?
Read on to see what’s happening in housing…
When looking at the totality of the various gauges of the progress of the US economy, the consensus is clear – economic growth is definitely slowing. However, adding some mystery to the economic equation, two separate reads on the residential market, housing construction starts and new home sales, have diverged…leading some analysts to scratch their heads. Are the experts wrong? Is the economy back on track?
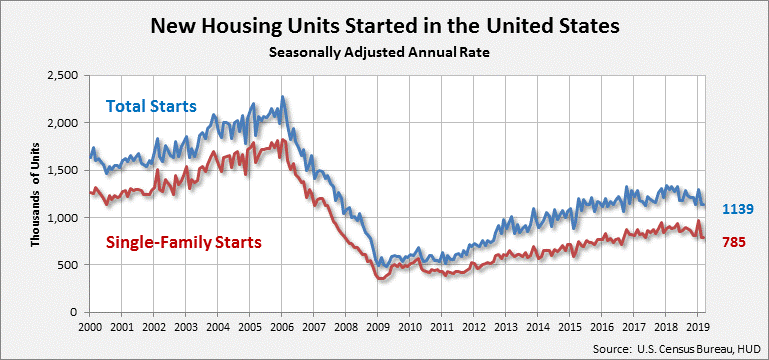
The first signal, the latest Commerce Department report on residential construction came out at the end of last week. It showed that overall housing construction starts in March had dropped to a seasonally adjusted annual rate of 1,139,000. This is 0.3% lower than the revised rate in February of 1,142,000 and 14.2% lower than the reading of 1,327,000 in March of 2018. It is also the lowest rate of overall construction starts since July 2018.
Single-Family Residential Construction
In the same vein, single-family starts, a reading I feel is more meaningful for the custom integration industry, also showed declines…coming in at 785,000 or 0.4% below the revised February rate of 788,000. This March reading was also 11.0% below the March 2018 rate of 882,000.

Most analysts read this result as further indication confirming an economic slowdown. In fact, that single-family result is the lowest rate of US single-family home starts in two-and-a-half years – since September 2016.
Then, New Home Sales Data is Released
Then, earlier this week, we learned about a related number, the number of new home sales for March. After new homes are constructed, logically, they need to be sold.
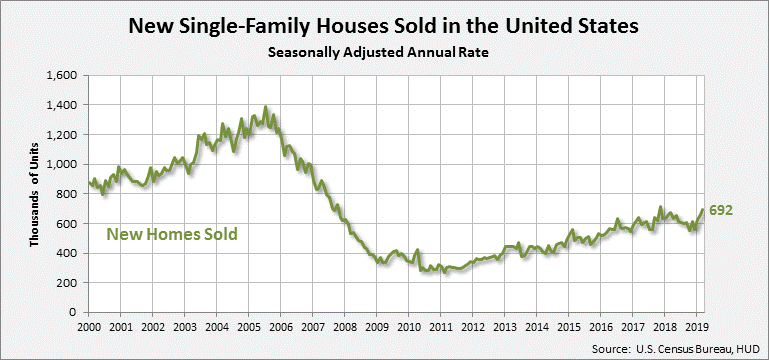
Surprisingly, the latest Commerce Department data shows that new home sales in March rose to 692,000 or 4.5% higher than the revised rate in February of 662,000…and 3.0% higher than the March 2018 rate of 672,000. This was a surprise, as economists polled by Reuters had anticipated a rate decline of 2.5% to 650,000.

Drops in Mortgage Rates and Home Prices Help
According to a report by CNBC, the reason new home sales increased was due to reduced mortgage rates, as the Fed has temporarily suspended their stimulus program which caused mortgage rates to increase. Also, pressures on buyers from inflating home price stopped as well – the report shows the median price for a new home actually dropped from $315,200 in February to $302,700 in March. Lower home prices and lower mortgage rates provided a double dose of stimulation, as they serve to make new homes more affordable – causing an acceleration in new home sales.
Looked at regionally, the Midwest, South, and West regions all showed growth, with the Midwest showing a surprising 17.6% growth. However the Northeast was hit hard, with new home sales dropping 22.2% there.
Are We Out of the Woods Yet? Most Likely No
Thanks to this robust overall burst in new home sales in March, the existing inventory of unsold new homes dropped from 6.3 months of inventory in February to 6.0 months in March – or a 4.8% decline. At the end of December 2018, the inventory of unsold new homes stood at 7.4 months.
So does this mean economic growth is back on track? Not necessarily…it could be a blip or anomaly. Economists are sure to continue to watch the sales number carefully…balancing that against all of the other economic variables. But it certainly is an interesting result.


Leave a Reply