 We were fortunate enough to receive an invitation from the National Association of Home Builders (NAHB) allowing us to participate in their annual Fall Construction Forecast presentation, a webinar put on for the benefit of their members last week. Boy! Are we glad we attended! Not only did the organization offer up a roster of world-class economists with really interesting insight into what’s going on in the economy – they also offered reams of really valuable data delineating the latest trends in construction.
Their predictions were – to put it mildly – shocking! Read below to find out why…
The NAHB regularly puts on presentations for its members where it shares the latest data on progress in the economy – and more specifically – in the construction industry, a prime driver of the overall economy. For this presentation, the association had presentations from three separate economists including Dr. David Crowe (Chief Economist & Senior Vice President, NAHB), Mark Zandi (Chief Economist, Moody’s Analytics), and Robert Denk (Assistant Vice President, Forecasting & Analysis, NAHB).
This was an impressive panel of presenters, top economists and experts in their respective fields. Dr. David Crowe went first and based his portion of the presentation on four key areas: recent economic activity, macro economic changes, first time buyers, and forecasts.
Dr. David Crowe
Recent activity…

Crowe started with a stacked bar graph showing five years of housing starts data, and the current year month-by-month activity in starts. Crowe noted that it is hard to discern a trend when the monthly activity bounces around so much. To make it easier, he provided 3-month or quarterly averages to show that, in fact, housing starts are moving up nicely in 2014…despite being erratic on a monthly basis.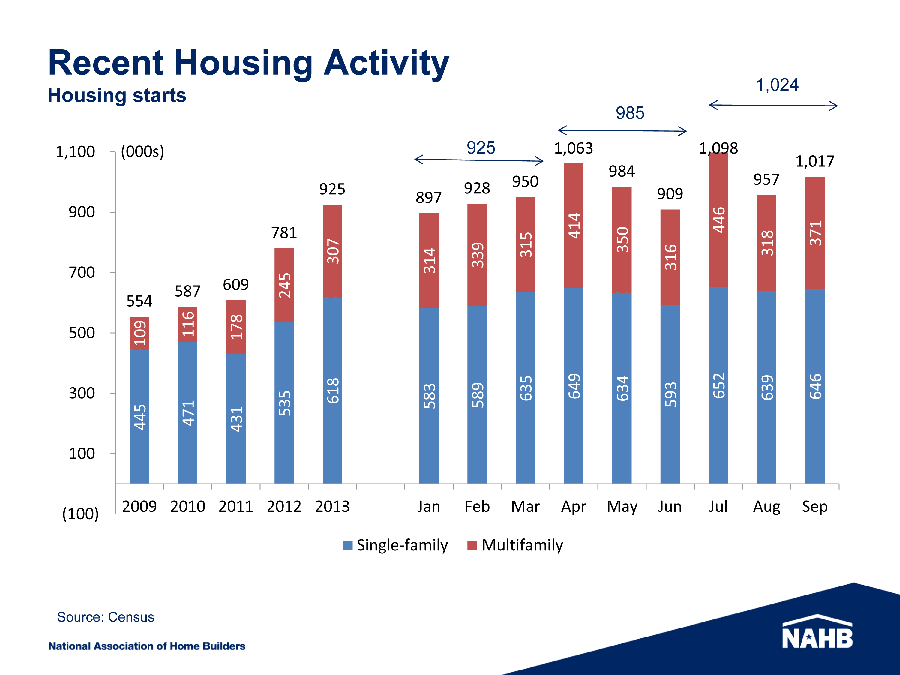
Crowe followed up this chart with another showing home sales, both new homes & existing home sales – also structured with quarterly averages. This chart as well, showed solid growth – now more easily visible on a quarterly basis. Crowe was, however, disappointed that new home sales haven’t grown as much as existing home sales.
Macro economy…
Moving to the macro economy with a chart on GDP (Gross Domestic Product) growth, the NAHB Chief Economist says that there was an anomalous downward blip in the first quarter of this year as far as real GDP growth goes. But that other than that, the economist is expecting GDP to consistently grow from this point forward. In part, he expects GDP to improve based on his forecast of construction growth.
Employment has made solid gains as well. According to Crowe, total US employment is now back to its pre-recession level. In the first quarter of 2008, employment stood at 138 million…falling precipitously to a low of 130 million by the first quarter of 2010.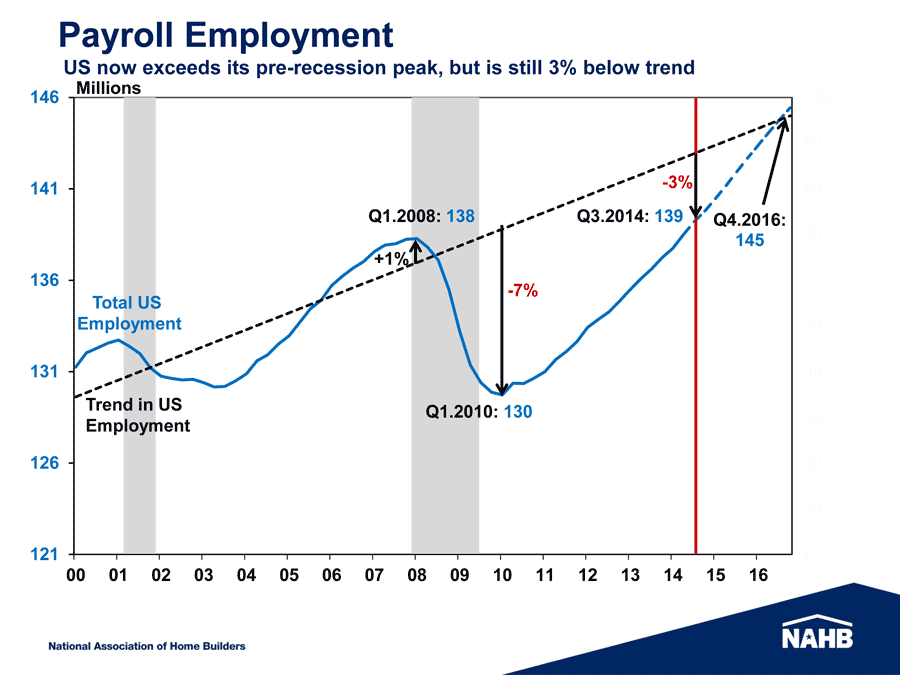
But new reports for the third quarter of 2014 puts employment at 139 million. Crowe further forecasts employment to grow to 145 million by Q4, 2016 – further driving the economy.
Continued growth in employment is important, Crowe told attendees, because there is a strong correlation between growth in employment and growth in single family housing permits.
Looking at employment from the other side…Crowe then showed a chart of unemployment rates – broken down by age group. All age ranges showed declines, but what’s more important is to notice the difference by age. Overall unemployment has dropped from about 9% to 6%…but the 20-24 years old range is still at 11% unemployment – and the 25-34 years old range is at 7%.
First-time buyers…
Why is this important? Because first time home buyers – an important statistic to home builders – tend to be in the younger groups, particularly the 25-34 years old range. As a result, they are not participating in the housing market right now.
Crowe also noted a “promising sign” of what he called real income growth for consumers. The economist showed a somewhat complex chart that plotted income growth for two periods of time: 1) change in income for the broader period between 2007 – 2013; and 2) change in income from the more recent period of 2012 – 2013.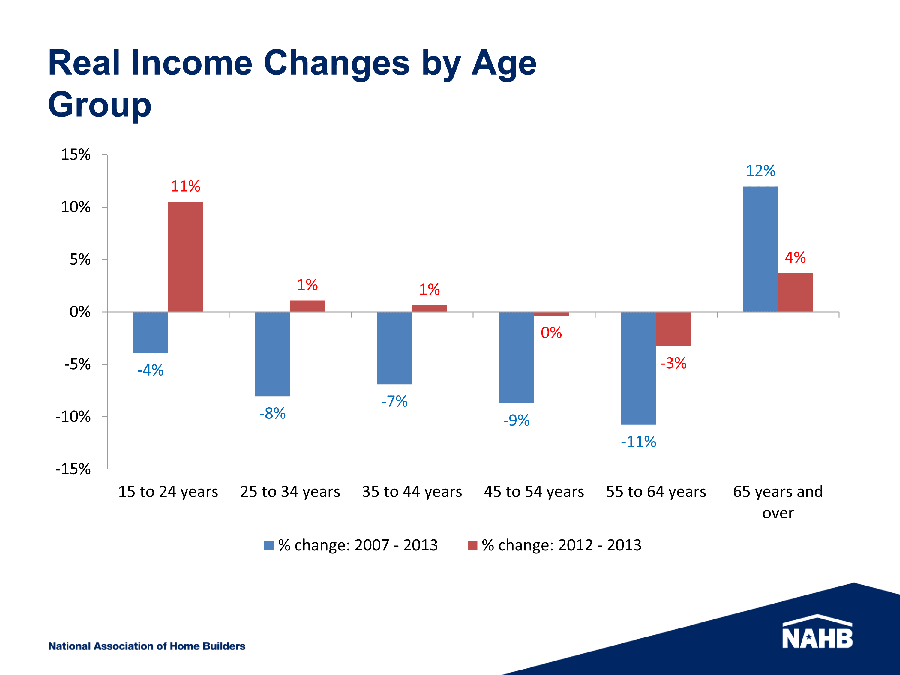
It was clear to see on this chart that from 2007-2013 (blue bars), almost all age groups lost income (except 65+up). However, in the more recent analysis of 2012-2013 (red bars), we see several groups’ income increasing – especially the 15-24 years old group.
“So that also is a promising sign, that this young age group is beginning to turn around their economic situation,” Crowe told attendees. “And we should begin to see them come back into the home ownership arena pretty soon.”
Forecasts…
Crowe’s forecasts were all pretty optimistic based on the many positive economic trends he discussed. Crowe looked at three areas: remodeling, multi-family, and single-family.
“So the remodelers have been feeling OK,” Crowe said. “Not joyous…not overly confident…but OK”
Crowe showed that remodeling activity bottomed out in 2009 and has been growing pretty consistently since then. Crowe sees no reason why that won’t continue as the economy continues to improve.
Multifamily “has been the star of the show” Crowe said, as he showed a chart with both the multifamily production index (basically a builder confidence rating) and multifamily starts. Both of these have shown consistent growth since 2010. Multifamily will continue to grow, but the pace of growth will taper off as production has caught up with demand.
But in the area of most interest to those of us in the custom integration industry, Crowe’s comments about the single-family market – and estimated future growth – were most interesting.
In the single-family construction market, Crowe showed a combo chart of builder confidence versus actual housing starts. Interestingly, builder confidence in this market has actually led starts for the last year or so. But single-family starts have also been slowly growing since bottoming out in 2009.
“We’ll have only a marginal increase this year over last year [in single-family starts], again mostly due to the fact that we lost ground earlier in the year,” Crowe told members. “I think we’ll finish off the year much stronger and lead into a pretty strong 2015 – mostly due to trade-up buyers…mostly due to those buyers who delayed have their purchase because of uncertainty about the housing market – uncertainty about their own job prospects, but have had a life change…have had a job change, children change, marriage change – those things that usually induce people to move to a new house. So I’m counting on them coming back into the market. I’m also counting on the existing home market not to climb significantly – and therefore new sales have to come in at a stronger ramp-up in order to answer that increased demand that won’t be answerable from the existing side.”
This seems like a lot of assumptions to justify a pretty incredible chart showing projected growth in starts. This chart showed the total number of single-family housing starts dropped 80% from its peak in 2006 of around 1.7 million starts. As of Q3 2014, starts have grown to about 48% of what the NAHB calls the “normal” rate of a little over 1.3 million units.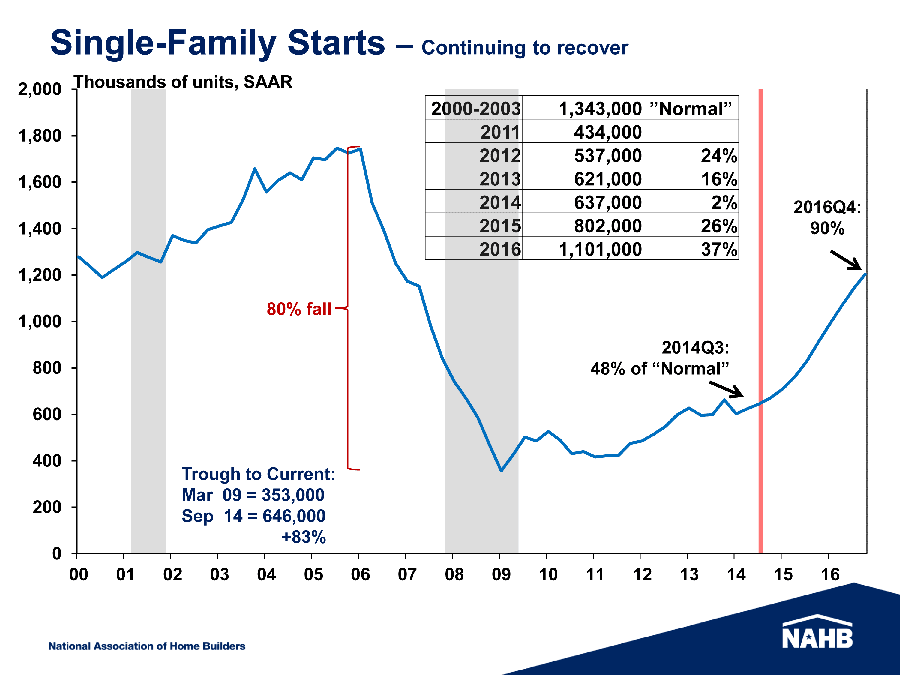
But Crowe’s forecast is for dramatic growth through 2015 and 2016, as shown on the right hand side of his chart. By the fourth quarter of 2016, the NAHB estimates that starts will be back to about 90% of the normal rate or about 1.1 million starts. This means he projects starts to grow a full 26% in 2015 and 37% in 2016.
These are robust estimates, for sure. And if true, bode well for home builders and related industries, such as custom installers and integrators.
Mark Zandi
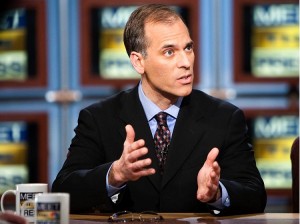
Unlike Dr. Crowe, Zandi is not a construction industry specialist – he is an economist of some renown – having been on certain business TV networks such as CNBC (the photo at left shows him on NBC’s Meet The Press) to discuss the economy. Zandi, like Crowe is quite optimistic about the direction of the economy and many of his points served to concur with similar points made by Crowe.
“Let me begin by saying that the economy – the broader national economy, and the housing market – broadly continue to improve,” the Moody’s economist started, setting the tone for his part of the program. “And I expect further improvement in both through my horizon over the next several of years – let’s say through 2017. I think prospects are good for continued gains in overall economic activity, jobs, and housing activity.”
Job market…
With that perspective, which even the economist admitted was “an upbeat perspective,” he went on to give his reasons. “The first is the job market,” he told attendees. “It is doing, actually, quite well.”
Zandi showed a chart with a breakdown of the job market, showing openings, hiring, layoffs and quits. The chart of each of these parameters showed the positive factors (openings, hirings) moving upward on the right side of the chart from 2012-2014; And the negative parameters (quits, layoffs) either flat or down.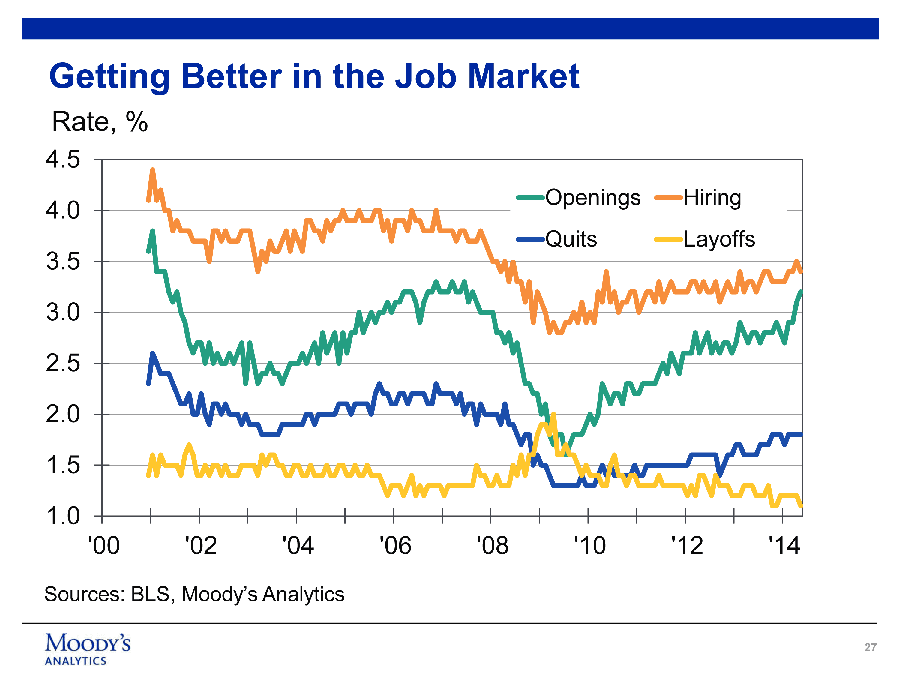
In reviewing the monthly data, Zandi said, job growth is currently about 225,000 per month – “That’s 2.75 million per year,” Zandi said. “Just for context, that’s about double the pace necessary to reduce unemployment and underemployment even assuming a stable labor force participation rate.”
Not only that, but Zandi told attendees that the quality of the jobs is improving. Earlier in the recovery, the jobs tended to be lower paying jobs, such as hospitality or retail. Now we’re seeing higher paying jobs, as well.
According to the economist, assuming trends continue, the U.S. will be back to full employment by late 2016. “So two years from now, we will be fully employed,” Zandi emphasized. And this will include “bringing in” many long-term unemployed – those who have stepped out of the workforce due to lack of job opportunities. And it includes part-timers who want to work full time. “We’ll be running a very tight labor market by the end of 2016,” he said.
Amplifying that trend, Zandi says wage growth will increase before then. “I would expect wage growth to be meaningfully above the rate of inflation by this time next year,” Zandi added.
“And of course, more jobs, higher quality jobs, and improving wage growth should lift consumer confidence – household confidence – more significantly,” Zandi emphasized. “It’s already much improved…but I think we’ll be at even higher levels of confidence by this time next year. And that augers very, very well for housing demand and the housing market more broadly.”
Getting their affairs in shape…
A second cause for optimism, according to Zandi, is that consumers have done a good job of getting their household balance sheets in order. Consumers have dramatically cut the amount of debt they carry – better positioning them to be able to consume again.
This is seen in the dramatic drop in the number of delinquencies both in non-first mortgage (i.e. credit cards) and first mortgages. First mortgage delinquencies are actually below the level they were before the recession.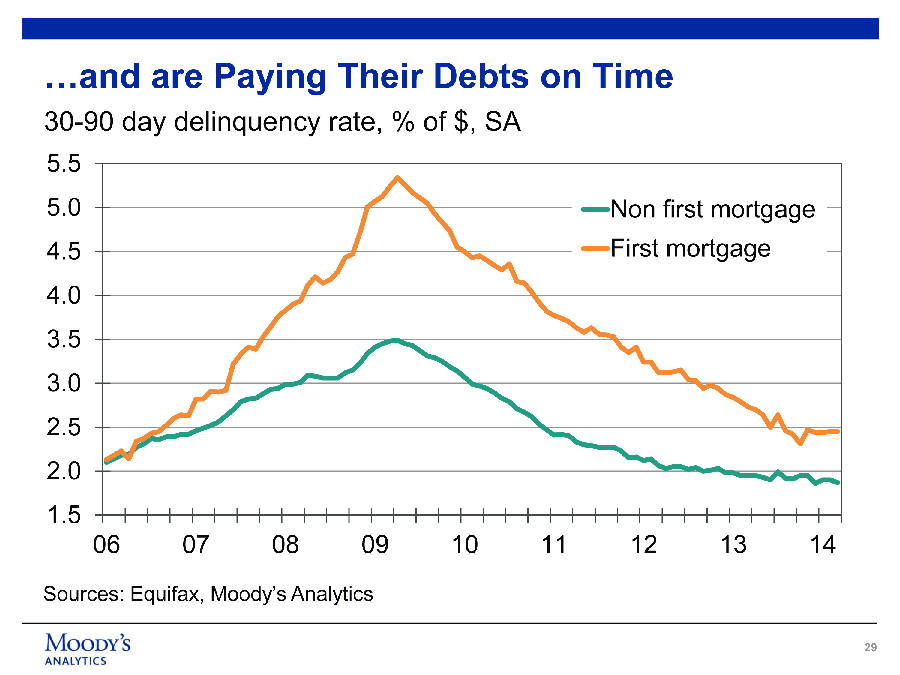
Housing supply shortages are coming…
The current level of construction is well below the level needed over the longer run, Zandi said. He showed a chart with a trend line representing the number of vacant units versus housing demand. Zandi sees demand topping 1.7 million units, but current supply is only running a little over 1 million units – creating a shortage.
This should spur demand for more home construction. “I’m very confident we’re going to see that ramp-up [of activity],” he told attendees.
Housing is a good value…
Zandi also showed a couple of charts to demonstrate that – from a historical perspective – housing is fairly valued. During the bubble years of 2005/2006, housing was more than 50% over valued. Now, however, the values have normalized.
This is true across the country, as Zandi put up a map of the country showing a color code by metro area of the housing values. Certain markets remain overvalued – the result of foreign investors, according to Zandi.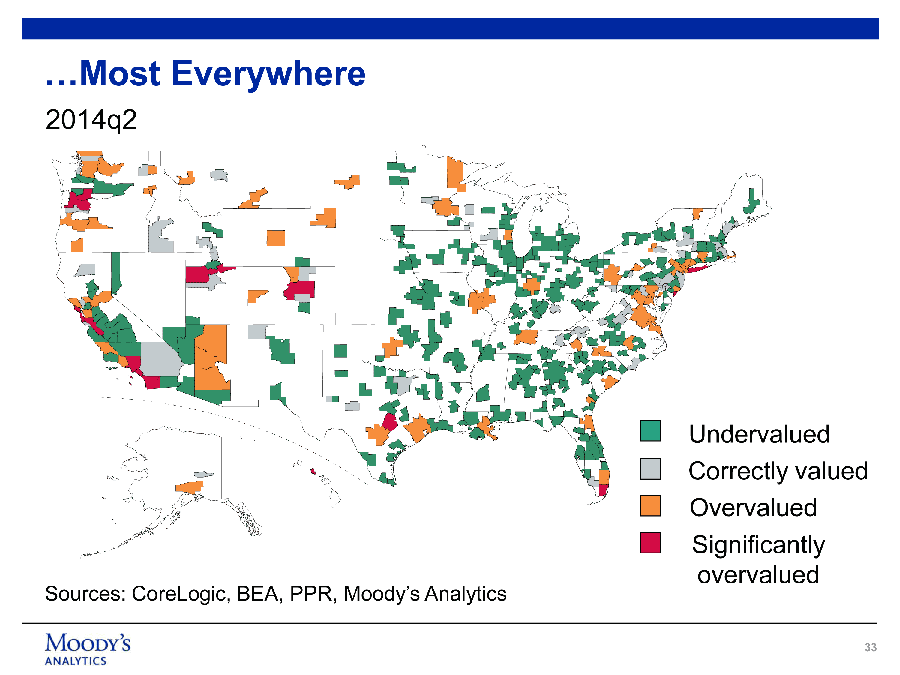
Threats to his view…
Zandi then discussed certain risks to his vision – those looming items that could cause his forecast to be incorrect. First and foremost among these is the Federal Reserve Board, which is in the middle of a quantitative easing program. Most experts expect them to begin tightening the money supply by raising interest rates starting next year.
The positive view expressed by Zandi could be thrown off if this tightening process does not go smoothly. As this situation has never existed before, nobody is really sure how the economy will react to this process.
Black swans…
Credit availability, is also a risk. As banks and other mortgage lenders have tightened up their standards, consumers need better credit scores to be able to borrow money. This could take longer than Zandi anticipates and slow down housing market growth.
Then Zandi reeled off a list of other black swans that could throw off his forecast. He cited stock market angst over Ebola, ISIS, potential terrorism, Russia/Ukraine, Iran’s nuclear program, tension in Asia…”you could go on and on and on,” Zandi told the group. “But my sense is, and the view behind my baseline optimistic outlook, is that these black swans essentially don’t fly – you know these are low probability events and they don’t occur. But if they do then obviously they basically blow apart our optimism and we’ll end up in a different place.”
Forecast…
Like Crowe, Zandi offered his forecast for the construction market. In Zandi’s case, he forecasts both multifamily and single-family on the same chart.
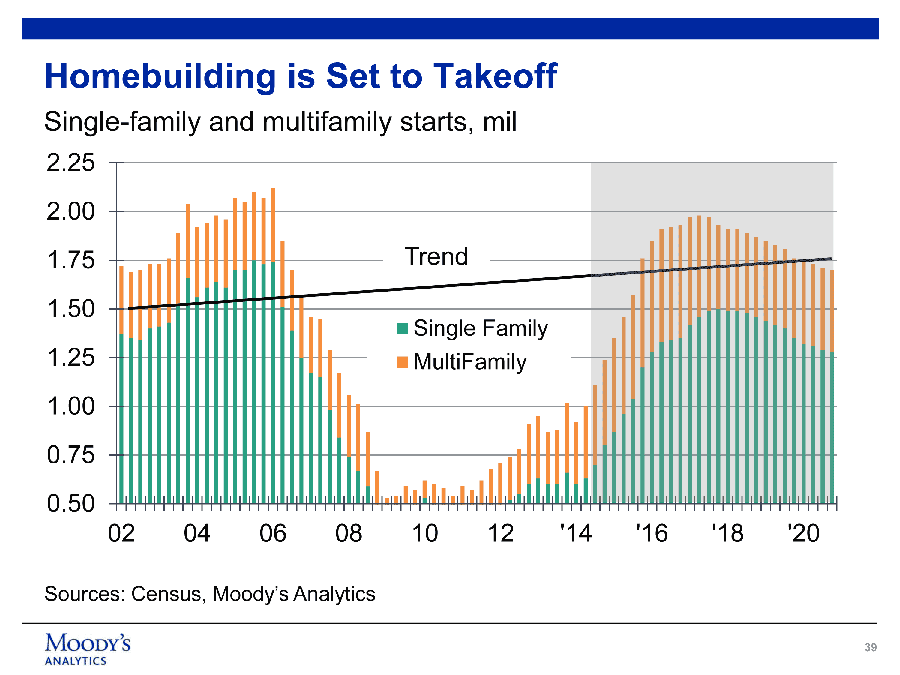
Of note, Moody’s chart supplies a trend line which right now says construction should be at about 1.7 million units and were “well below trend.” And like Crowe, he sees construction taking off in 2015 and by 2016 exceeds the trend line.
“It’s an optimistic outlook,” Zandi told the group. “As I said, I’m not quite as confident about the pace of the ramp up – feeling very confident in where we’re headed. I think our prospects, particularly for you all in the home building industry, are quite good over at least the next several years.”
Robert Denk

Mr. Denk sought to put a finer point on the data – some of which was already presented…and to do a further breakdown of how the trends are affecting specific market areas. This additional breakdown was to include some geographic areas as well as industry segments.
Denk started with a more detailed explanation of how the NAHB came to adopt the standard of 1.3 million starts representing the “normal” construction market condition. Showing a chart of housing starts from 1990 to 2014.
How the NAHB decided what was ‘normal’…
Denk chart was not unlike others we had seen – except that he had added a trend line showing the normal market growth up to about 2003. It was then easy to see an unusual bump up in starts that continued until 2006. We now know this to be the bubble – which quickly…and dramatically…burst, launching an unbelievable and scary plunge in residential construction.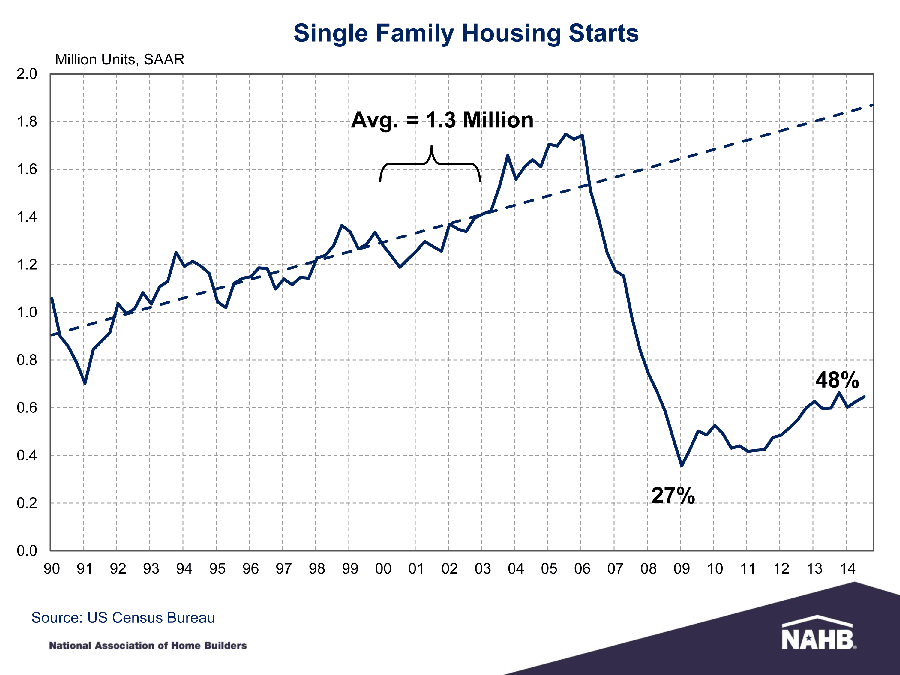
Denk pointed to the period of 2000-2003, where starts averaged 1.3 million a year, and said – basically – that the NAHB arbitrarily selected this range, just before the bubble, as its new normal level. This was the period just before the obvious bubble build-up.
As identified by Crowe, Denk says at the deepest point in the trough, starts were only about 27% of this newly designated normal level. This is not 27% of the 2006 peak level…but of the 1.3 million normal.
The ride’s getting kind of ‘bumpy’…
Although starts are currently very “bumpy” on a month-to-month basis, the NAHB says starts are basically now at 48% of normal…and well over the trough. They are referring, however, to that little peak at the end of 2013 as the 48% point (see the slide, “Single Family Housing Starts”).
“That’s pretty good progress from 2007, but it’s also a good indicator that there’s still a little more than half of the recovery to go in the single-family sector,” Denk pointed out to attendees.
Denk then showed a chart that compares the level of construction during the trough (lowest level, in blue) versus current (in red) in each of the 50 states. The data were organized based on lowest to highest in production during the trough.
Starts broken down by state…
Horizontally across the bar graph of each states performance are two dark blue bars. The lower bar represents the U.S. average level of production during the trough; the upper bar represents the current U.S. average level of production.
This chart, in an instant, allows you to see where your state was at during the trough…and to visually see where it is at now. Keep in mind the levels are based on percentage to average. This is why a state like Montana is seemingly a rock star…the actual numbers of starts are low which somewhat skews the percentage.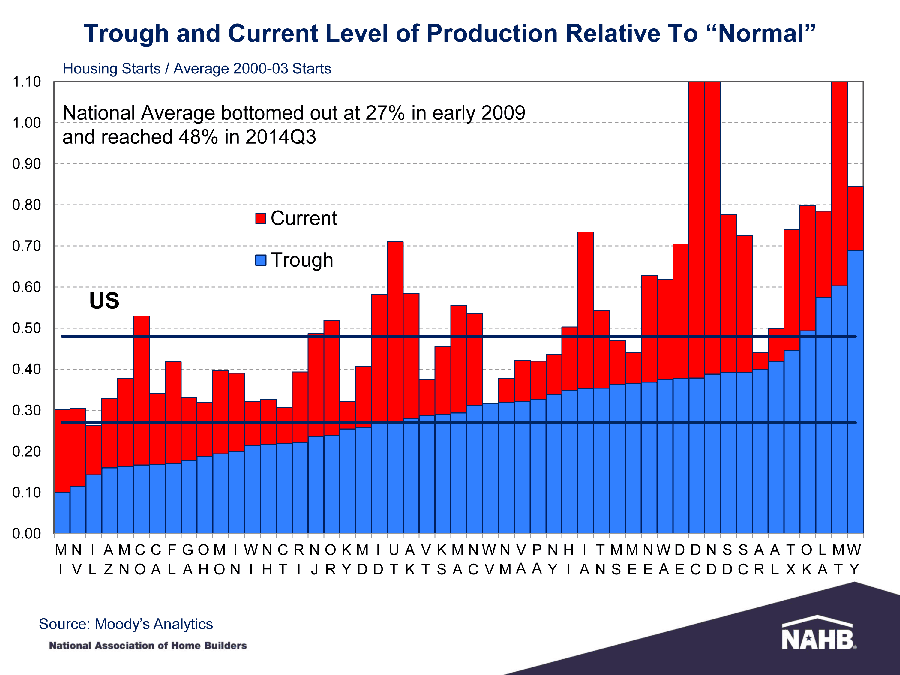
The chart makes it easy to see the states with the most pain with the highest level of stress (on the left)…and those with the least pain and distress (on the right). Denk also mentioned that North Dakota results are skewed due to a recent energy boom, as is Washington DC’s with a government employment run-up. These are therefore extraordinary results…not real indicators of normal conditions.
The ‘poster child’ of pain…
The “poster child” of pain, as Denk put it, is Michigan, who saw its housing construction drop to only 10% or normal. And Nevada, Illinois, and Arizona are not far behind those Michigan results.
“So this chart shows the difference in the level of distress at the bottom,” Denk said. Then, trying to be more upbeat, added, “It also shows that no matter where you are, there’s been some level of recovery.”
Denk did sound the alarm on one interesting analysis – the price-to-income ratio. The NAHB tracks both house prices…and per capita income levels and plots them on a graph showing the ratio between the two.
The Price-to-Income Ratio…
Historically, the ratio between these two variables is 3.20. At the height of the bubble in 2006, the ratio ballooned to 4.77 or 150% of normal. Then, like everything else, the balloon popped and the ratio settled back to the normal 3.2 or so.
As the economy has begun to improve, housing prices have begun to rise. After dropping to an average of about $165,000…home prices are now up nationally over $200,000 on average.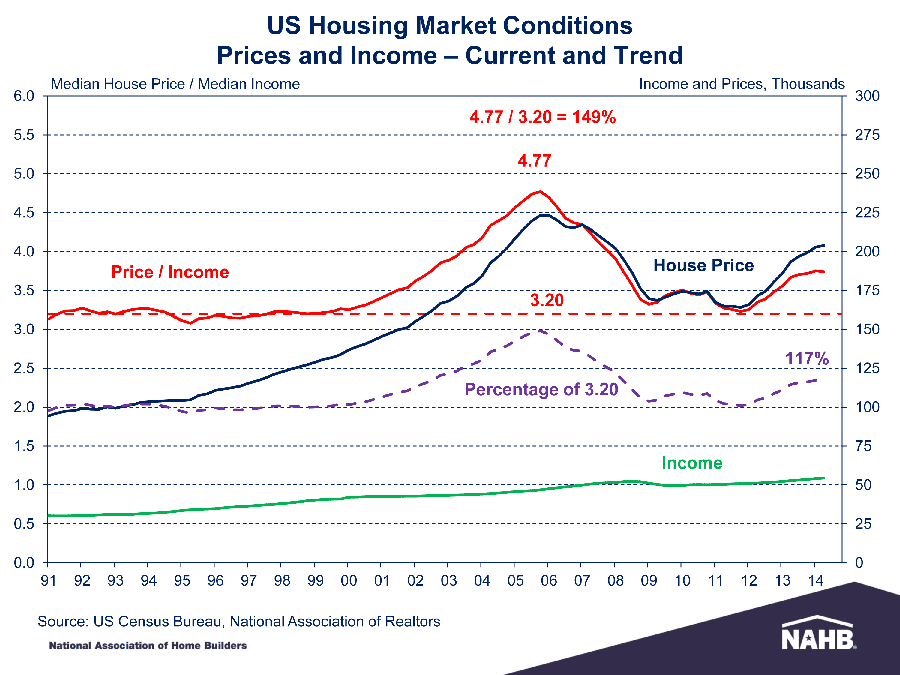
But incomes have risen only slightly – recovering at a much slower pace. What this means is that their price-to-income ratio has bumped up again to 117% of normal.
“I’m not ready to call that a bubble,” Denk said hopefully. “I think that’s just a healthy recovery in house prices and I think its pretty clear we’re only about a third of the way into the deep trouble that we got during the housing boom.”
Foreclosure inventory…
Like Zandi, Denk talked about the dramatic drop-off in the number of foreclosures. Showing a chart with “foreclosure starts,” number of over-90 days delinquencies, and overall delinquent inventory – Denk noted that foreclosure starts are now back to their normal levels.
The number of over-90 days delinquencies and inventory are both also well off their peaks…but still far from the normal level. Denk noted that it takes time to work through the process and the inventory.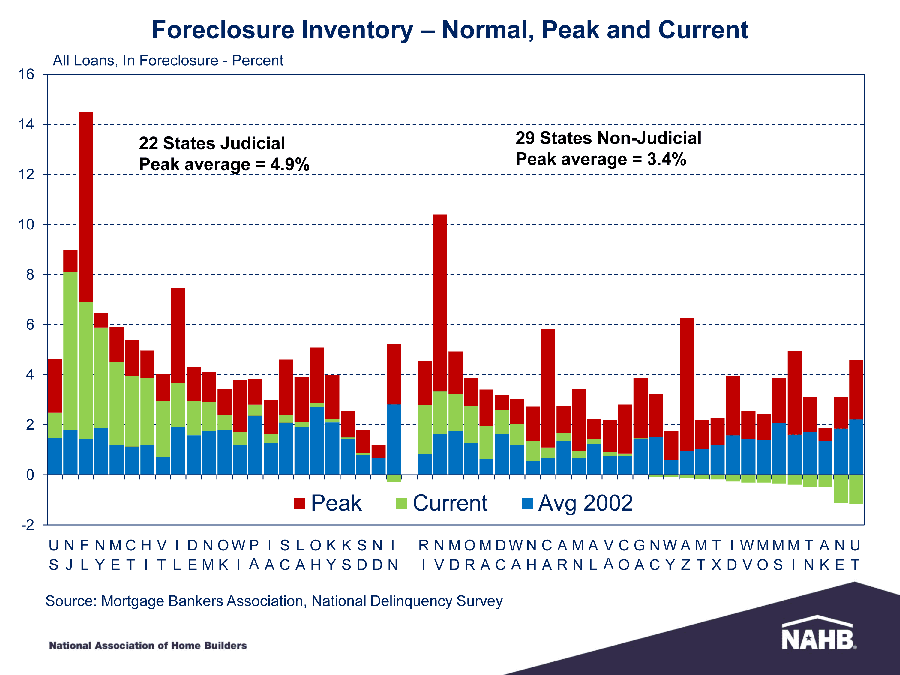
Denk showed a chart of delinquent inventory which was a stacked bar chart with peak, current, and normal delinquencies plotted for each state. Denk said that 22 states have a “judicial” foreclosure process and 29 states have a “non-judicial” process. Those with a judicial process take longer to work through their delinquent inventory.
Several states now have a foreclosure rate below the 2002 or normal rate. By the way, we were surprised to see that New Jersey has the highest level of foreclosure inventory in the whole country. Although given the density of our state’s population – perhaps we shouldn’t have been.
Forecast…
Denk used the same projections as Crowe to forecast a significant upswing in construction over the next two-to-three years. Denk said the NAHB is confident that by the end of 2014, starts will be up to 50% (currently 48%) of normal production levels.
He then went on to say that by the end of 2015, we will hit 68% of normal for single-family housing starts. And by the end of 2016, Denk says we will be all the way up to 90% of normal level of production.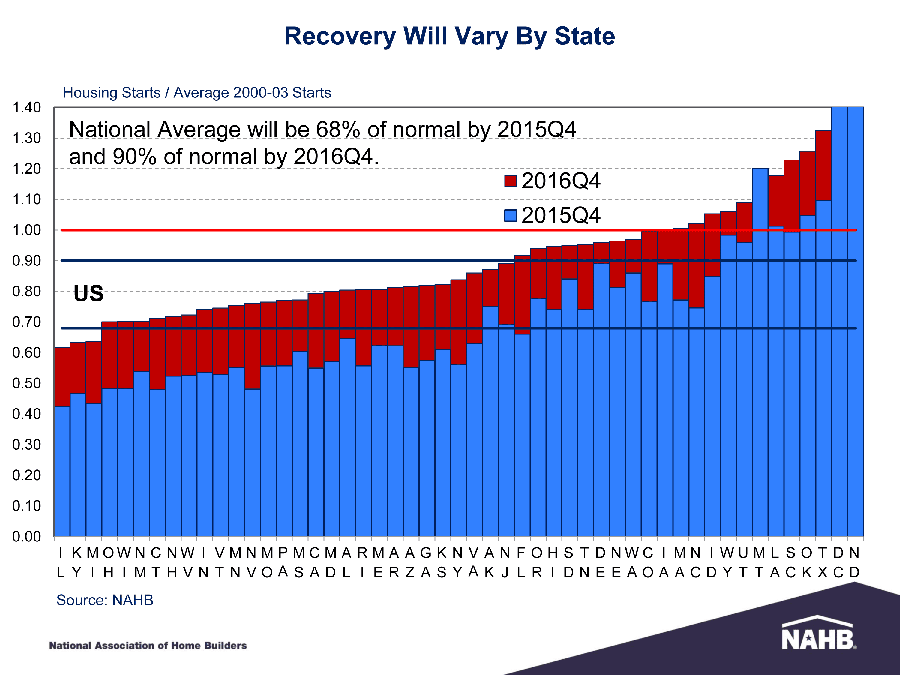
Breaking it down to a state-by-state level, Denk put up a stacked bar chart (he admitted this is his favorite type of chart) with the expected level of housing starts by state. Two dark blue horizontal lines represent the national average forecast of 68% in 2015, and 90% in 2016. A red horizontal line highlights the 100% of normal level.
For each state, Denk plotted their expected level of housing starts at the end of 2015 in blue, and at the end of 2016 in red. Again this makes it easy for you to see the expected level of construction growth in your state.
Denk noted that there are a handful of states expected to hit normal by the end of 2015, as seen on the right hand side of his chart. By the end of 2016, there are even more.
He followed this with a U.S. map plotting the same basic data – making it even easier to see where the U.S. will stand by the end of 2016. Hint: the rust belt remains creaky.
Our takeaway…
The NAHB and Moody’s economists presented a long and detailed view of where the construction industry has been, where it’s at now, and – most importantly – where they see it going. We were surprised at the amount of unbridled optimism of this august panel. It was almost as though they had thrown caution to the wind.
While the data are compelling – thrilling really – we found ourselves in sort of a “pinch me” moment. Is this a dream? After several long years of tortuous decline…nirvana is just around the corner? Really?!?!
We want to believe it’s true. But these are human beings and statistics. And human beings can be wrong…and statistics can be misleading. By the end of the presentation…we began to feel a growing skepticism.
And judging from the questions the panel received from NAHB members – home builders, remember – we were not alone in our skepticism. Let’s hope the economists are right. Because if they are…happy days are here again.
A big THANK YOU to the NAHB…
We’d like to express our heartfelt gratitude to the National Association of Home Builders for inviting us to attend this remarkable event. We would also like to thank David Crowe, Mark Zandi, and Robert Denk for amazing presentations. We learned a lot during this event – the quality of the content was second-to-none. And the quality of the insight by the presenters…was without peer.
We would also like to congratulate the NAHB for putting on such incredibly informative events for their members with such high quality content. If you are a builder and you’re not a member…you should join.


Leave a Reply