STRATA-GEE.COM EXCLUSIVE
 Last month, we reported that CEDIA released its 2013 Benchmarking Survey with certain select data highlighted. Now CEDIA has offered Strata-gee.com an exclusive look at the full report (the summary version provided to all CEDIA members) with the opportunity for us to highlight any results we found particularly enlightening. And in the process of reviewing their results – we discovered a much more comprehensive read on the “typical” CEDIA member than we had originally expected.
See more on some of the more interesting results from CEDIA’s 2013 Benchmarking Survey…
Over the years, one of the great challenges of the custom integration channel was that reliable marketing data just wasn’t available. CEDIA – the trade association that best represents the channel – had received a lot of pressure from members and other industry participants to begin collecting such data.
A few years ago, the group responded and began collecting data to be able to offer realistic and responsible benchmarking information for its members. The result has been a boon to members who – finally – has a reasonable yardstick against which they can measure their progress. By reviewing the collective data, a smart custom integrator can see where he/she is doing well – and more importantly, which performance areas need to be addressed and improved.
More expansive…
The first thing we noticed about the 2013 Benchmarking Survey is that it was substantially more expansive than we had originally believed. Several of the categories featured extensive data drill-down to specific, and meaningful, individual data points. This is a great help because there is enough detail that if one figure doesn’t seem to relate to your individual business – another almost certainly will.
We received a “summary” version of the report from CEDIA, which is the same report that all of the association’s members receive. It is a full 20-pages long with about 15 pages of deep data presented.
Participants get even more…
Those CEDIA members who actually participate in the survey receive an even more extensive 82-page report with yet more detail. Not only that, but the report that participants receive includes a custom analysis of how their individual data compares to the overall results. Considering that companies can pay thousands of dollars to get this type of detailed market information…it’s a bargain.
For the 2013 survey, 66 U.S. and Canadian CEDIA members participated by filling out and submitting an extensive survey on their company earlier this year. The data was collected and compiled by an outside company and no individual company’s results were seen by any other dealer or CEDIA staff member – preserving each dealers confidentiality.
Financial summary first…

(Click to enlarge)
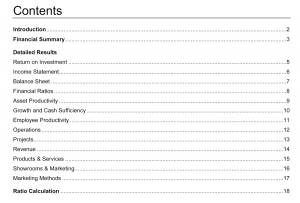
The report starts with a “Financial Summary” or overview of the financial performance of the typical CEDIA members. This is followed by more detailed reports on: Return on Investment, Income Statement, Balance Sheet, Financial Ratios, Asset Productivity, and much more. (See a full Table of Contents at right.)
Results are reported based on a calculated “median” basis…rather than “averages.” As most statisticians would concur, results based on averages can be overly swayed by one or more extreme result. On the other hand, the median – the point where half of the participants’ results are above and half the participants’ results are below – is a far better representation of the “typical” member.
Specifically breaks down…
The survey covers the typical members’ financials. So members can see, for example, that the typical member reports revenues of just under $1 million. Also, members report operating expenses of 33.2% of revenues. But thanks to the report’s level of detail – members can see just how that overall operating expense number breaks down into separate specific cost items – i.e. personnel expenses, building maintenance, vehicle expenses, etc.
Since most accounting software packages used by custom integrators offer them the ability to print out reports based on their data – it is easy to compare your results with the typical CEDIA member’s results. Again, this can help you target areas for improvement…or see where you’re beating the crowd.
Educational depth…
The first half of the report is deeply financially driven. We like the fact that in addition to the reported results, CEDIA has provided a series of financial ratios to better gauge business health. Since many integrators are not accountants, the association helpfully provides the formulas used to calculate each ratio. This adds another level of educational depth to the report.
However, while the formulas are provided and a short definition is often included – there is no guidance offered on what acceptable or recommended ranges of performance should be. So, for example, it may interest a member to know that the results show a “Defensive Interval” of 56.1 days. And even though the formula is provided [Defensive Interval = Cash ÷ (Operating Expenses – Depreciation ÷ 365 days)] and defined [“The defensive interval measures how long the firm can operate using nothing but existing cash balances.”]…members are not told whether the reported 56.1 days is a good result or a bad result.
Picking nits and PITs (profit improvement tactics)…

Senior Director of Research
Still, we don’t want to nitpick too much, because clearly CEDIA is doing a great service to members to provide them with the level of information offered. We have long recommended that custom integrators should dig deeper into their operations performance to tighten up their efficiencies. There are just too many opportunities in an integration operation to develop “leaks” in your profit bucket. Only by scrutinizing your financials on a regular basis, will you discover these leaks such that you can plug them and improve your profitability.
The second half of the report offers a tremendous amount of extremely tangible benchmark data such as: Years in Business; Number of locations; Have a written business plan?; Have a written marketing plan?; Basis for Design Fees? (e.g. 39.3% base design fees on estimated hours); Collect Design Retainers and How Much?; and much, much more.
There is a section where members reveal the tactics they are taking to improve profits with 11 different methods mentioned. The top three methods are: Standardized Operational Processes (80%); Expanded Service and Technology Offerings (78.5%); and Sold More Upgrades and Add-Ons (73.8%). The wide range of options can give those members who did not take the survey, ideas of ways that they too can improve their profits.
Results forecast a dramatic upswing in residential construction…
There are a lot of results in this report we found interesting. For example, survey respondents reported that 69% of their residential revenue came from retrofit & remodel projects, while 31% of their residential revenue came from new custom construction. This did not surprise us and is consistent with what we’ve been hearing from around the country.
But what was interesting is that, when respondents were asked what they forecast these percentages to be for the coming year, retrofit and remodel was projected to drop to 60% , while new custom construction is expected to grow to 40%. Obviously, there is anticipation of a reinvigorated residential construction industry.
Respondents rate revenue growth and marketing tactics…
In fact, the respondents forecast revenue will grow 18.2% for 2013…well over least years growth of 10.2%. However, respondents had forecast growth of 12% for 2012 – so perhaps the final number for 2013 will be a little more moderate than their optimistic forecast.
Another surprise for us was some of the results related to custom integrators’ marketing activities. While most rely on referrals as a primary source of sales, nearly 4 in 10 report using a professional “Advertising/Marketing/PR Firm” (38.5%).
The top three (of many) marketing initiatives are: Social Media (60.6%); Networking/Education (with residential professionals) (60.6%); and Referral Fee/Incentive (existing clients/business relations) (51.5%). However, when asked to rate the success of marketing initiatives on a scale of 1-3 representing poor-to-good, no method received better than a 2 or neutral rating.
Overall, an impressive initiative…
Overall, we were impressed with this initiative by CEDIA. If we were a custom integration company, the power of the information offered by this survey would be reason enough to join the organization. And, of course, there are many other valuable reasons to become a member.
The report could be improved by adding guidance for many of the ratios and results produced. Also, we would like to see a year-to-year analysis as well. It would be helpful to see how the membership is progressing on the many initiatives reported in this survey over time. Finally, some well designed graphics could greatly aid reader comprehension of this data-heavy study.
But bottom line: if you’re a custom integration company who has not yet chosen to be a CEDIA member, you would definitely benefit from joining so you can get this report and see how your company is performing versus an objective and relevant industry benchmark.
And if you ARE a CEDIA member, you would GREATLY benefit by participating in this annual survey both to receive even more information (including data from a separate High Profit subset of members) AND to get a custom analysis of how YOUR data stacks up against the norms.
To learn more about CEDIA’s 2013 Benchmarking Survey – or to participate if you are a member – click through here… OR email Erica Shonkwiler at: research@cedia.org.


Leave a Reply