<April 25, 2012> The National Association of Home Builders (NAHB) held their annual Spring  Construction Forecast webinar for members of the press today, and the organization’s forecasts were decidedly – if cautiously – optimistic. Forecasting rebounding growth in several important categories, the NAHB is clearly suggesting that better days are ahead.
A key indicator of the housing market’s economic health, we follow NAHB and government data closely as the housing market is key driver for the consumer electronics industry generally, and the custom integration channel specifically. The Spring Construction Forecast webinar was started several years ago by the NAHB so its economist’s could share the data they compile with the press.
A brainy group…
This year, the webinar featured three key executives who presented and explained an almost dizzying array of data. David Crowe, Chief Economist & Senior Vice President of the NAHB; Chris Varvares, Senior Managing Director & Co-Founder, Macroeconomic Advisers; and Robert Denk, Assistant Vice President for Forecasting and Analysis, NAHB. A brainy group indeed.
Starting off the conference was Crowe who shared some positive data such as builder sentiment and a housing market index, both of which were up over the last couple of years. But then, Crowe delved a little more deeply into quarterly data, which tends to smooth monthly trends into a more readable format.
Crowe noted that while payroll employment had dipped in March, prior to that, it had shown a nice increase for the previous three quarters. Unemployment, while still high, has been trending downward since 2010.
Fundamentals are fun…
NAHB’s economist also discussed fundamentals that also seem to indicate a positive trend. The message is that current data has settled back down to normal levels as compared to the bubble period of 2004-2007. Data such as the number of households and the ratio of housing price to income have dropped below their inflated highs of the bubble period back to more normal levels.
And the economist reminded everyone that mortgage rates remain at historically low levels. This means that homes are more affordable than they were during the bubble period.
Delinquencies are down…
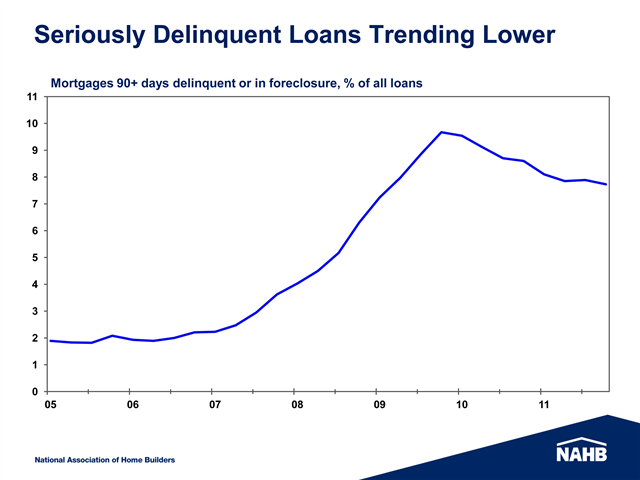
Crowe also noted that delinquencies are also down – although still at distressingly high levels. Interesetingly, when looking at the inventory of delinquent homes, the average for the U.S. is 8.4 months worth of distressed inventory. That is, it would take about 8.4 months to sell through this inventory.
But in some states, this rate of inventory can be much higher, such as Florida with 19 months worth of distressed inventory. But it can be lower too. Crowe noted that 24 states have less than six months of distressed inventory.
Fearless forecasting…
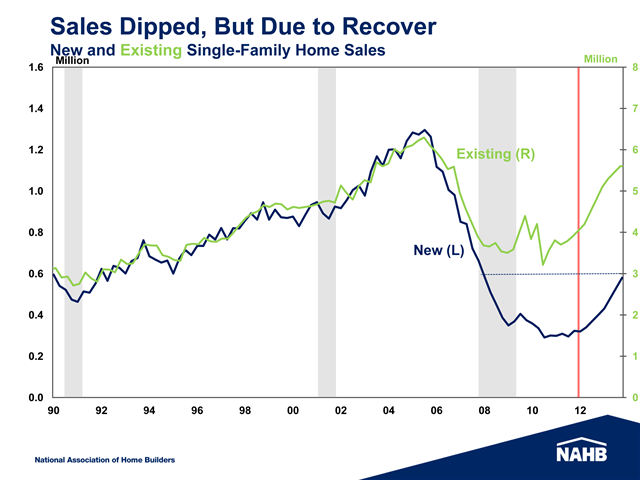
But most interesting was when the economist got to his forecasts. The NAHB is forecasting up trends in key areas, including sales of new and existing single-family homes for which it showed significantly upward sales through 2014. This is especially surprising as single-family sales had their worst years ever in 2011.
The NAHB says single-family starts are also headed up. According to Crowe, single-family starts will hit 660,000 units in 2013 which is 30% higher than 2012’s 506,000 units. And 2012’s forecasted rate of 506,000 units is a full 17% over the 433,000 units started in 2011.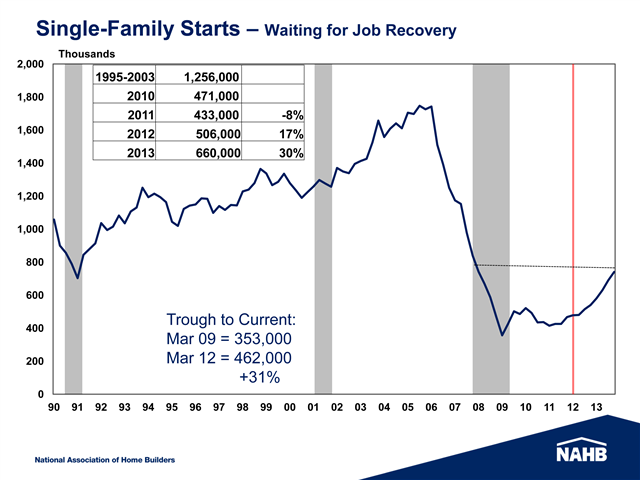
Of course, 2013’s 660,000 units is still well below the almost 1.3 million unit average from the period of 2000-2003 – or the stable period before the bubble. Still, this is a significant improvement.
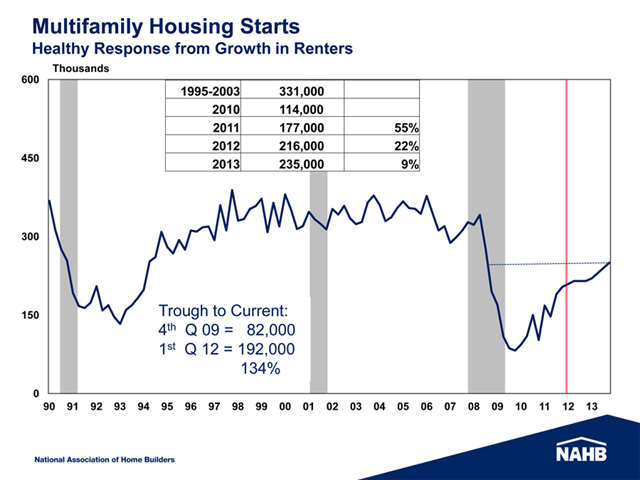
Multi-family housing, which is on a different trend than single-family is already doing fairly well…”almost unbelievably well.” The organization expects multi-family to continue to grow, albeit at a more modest pace to a total of 235,000 units in 2013 or 9% over 2012’s 216,000.
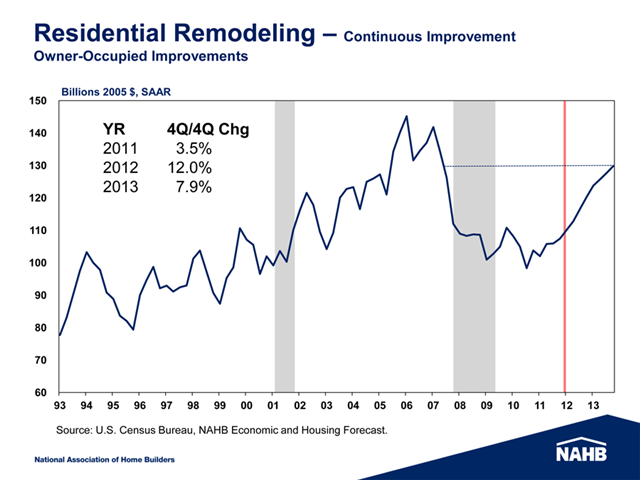
Residential remodeling is also forecasted to show respectable growth. Here, like multi-family, RR grew in 2012 by 3.5% as compared to 2010. The NAHB expects a 12% rate of growth in 2012 followed by a 7.9% rate of growth in 2013.
Finally, Crowe showed a colorful map of the United States called the “Long Road Back to Normal.” The color coding on the map was meant to represent the number of single family starts as a percentage of “normal” or the rate of 1.3 million units (again, 1.3 million is the average rate of starts from the period of time prior to the bubble, 2000-2003).
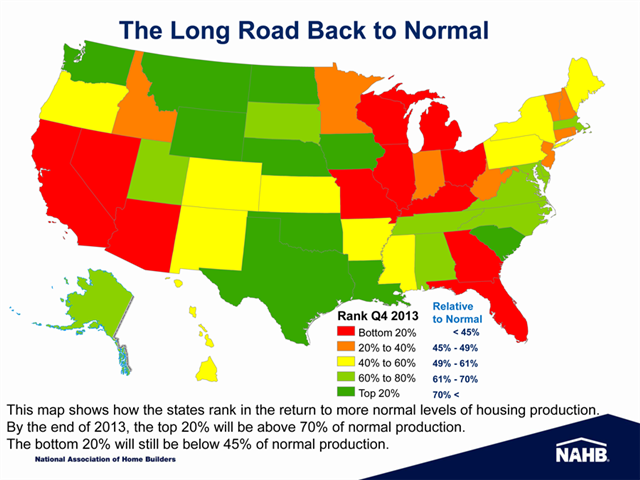
On this chart, the closest to normal are those areas in dark green which represents “greater than 70% of normal.” Most of these states are in the lower and upper Midwest areas. Those states in red are the least normal achieving “less than 45% of normal.” These states are mostly in the rust belt and western states.
So while some of the data including sobering statistics – nationwide, we will still only be at 55% of normal housing construction by the end of 2013 – overall there was a lot of positive forecasting that growth will finally pick up. And, says Crowe, their optimistic forecasts are supported by demographics.


Leave a Reply