The Census Bureau, in cooperation with the U.S. Department of Housing and Urban Development, released new home construction data for November, offering details on what is generally known as housing starts. The overall construction starts – which includes both single-family and multi-family homes – both showed increases over the revised numbers for October, suggesting a return to economic stability after a period of concern about a possible slowdown.
See more on housing construction starts…
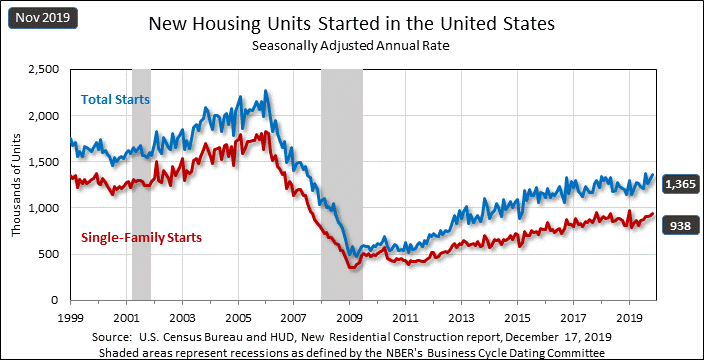
Overall residential construction starts in November increased to a seasonally adjusted annual rate of 1,365,000 units. This is a modest 3.2% over the revised rate in October of 1,323,000 and fully 13.6% above the rate of 1,202,000 booked in November 2018.
Perhaps the more pertinent data to watch is the single-family construction rate, which I feel is an even better indicator as it has a closer tie to the custom integration industry. Here too, we find that single-family housing starts came in a a rate of 938,000 or 2.4% higher than the revised October rate of 916,000. This is also 16.67% above the rate of 804,000 in November last year.

Diverging Revisions Noted
By the way, the revisions of the initially reported rates in October often track each other. In other words, if the department ultimately revises the overall number up…they usually revise the single-family number up as well. However, this month, that pattern diverges – the overall number was revised upwards (from 1,314,000 originally to 1,323,000)…while the single-family number was revised downward (from 936,000 initially to 916,000). Not sure just what that means, and it may mean nothing…but was something I noticed in this latest report.
Interestingly, when looking at the geographic breakdown of the overall starts, we see that two regions showed increases – the South (+10.3% vs October) and the West (+1.4%) – while the other two regions showed declines – the Northeast (-3.7%) and especially the Midwest (-15.5%).

Geographic Results Diverge as Well
But when we look at the geographic data for single-family starts, we see the same 2/2 split for the four regions…but the regional results are for different regions – the UP regions are the West (+8.8%) and surprisingly the Northeast (an amazing increase of +67.6%) – while the DOWN regions are the Midwest (-0.8%) and the South (-4.1%).
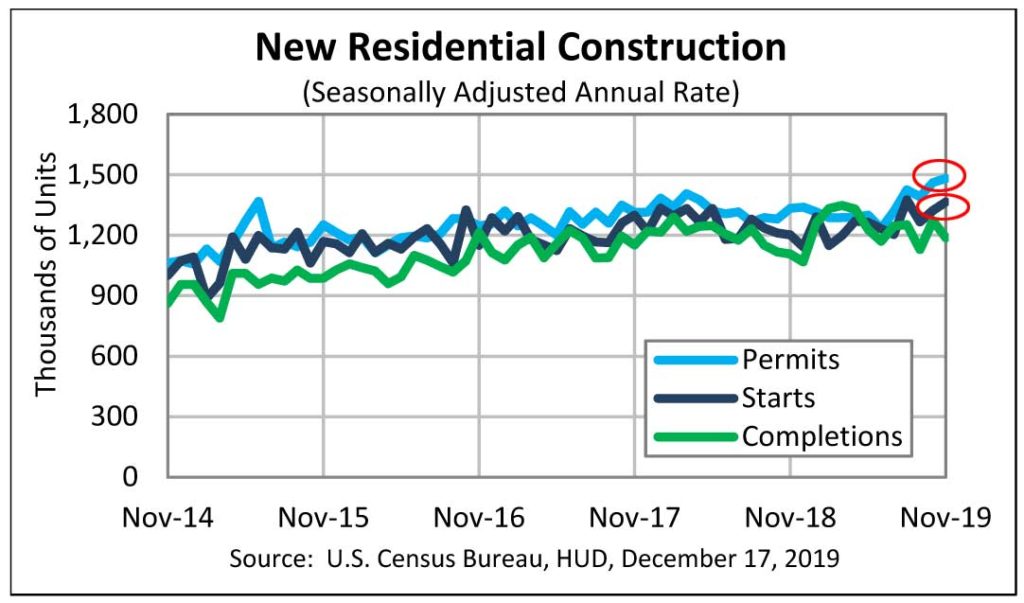
The government also released data on building permits issued…widely viewed as a leading indicator for future construction. Here too, we see an increase – if yet at an even more modest rate. Housing units authorized by permits in November were at a rate of 1,482,000 units or 1.4% above the revised October rate of 1,461,000.
Permits for single-family homes also rose in November to a rate of 918,000. This is just 0.8% above the rate of 911,000 in October. However, this rate is also a more respectable 8.9% over the 843,000 rate booked in November 2018.
A Welcome Return to Economic Stability, for Now
After a sharp dive in the rate of housing starts reported in September, starts returned to growth in October…and now again in November. Overall, it is hard not to conclude that this is but another indicator that the economy has re-stabilized…after a period of a few months where it looked as though things were about to fall apart. That is good news…at least for the moment.
Given that we are in the heart of the end-of-year holiday season…we’ll take a little good news.


Leave a Reply