 <March 21, 2012> An investment expert once told me that Wall Street is most dangerous when everyone agrees on the market’s direction – either up or down (bulls or bears in Wall Street parlance.) If everyone says the market is going up – then the market is likely a bubble headed towards a burst. If everyone says its going down, then we’re probably in a crash and hard times are ahead. No, it’s safest when investment and economic experts – and the underlying data they rely upon – is mixed…which is exactly where the housing market is right now.
As longtime ALERT readers know, we frequently write about the housing market. There are two reasons for this: 1) We are of the opinion that housing construction, and the resultant sales and home formations, are a fundamental driver of the consumer electronics market; and 2) We are in the midst of…and likely at the end of…the most spectacular collapse of a fundamental pillar of the U.S. economy in our lifetimes.
The key metric…
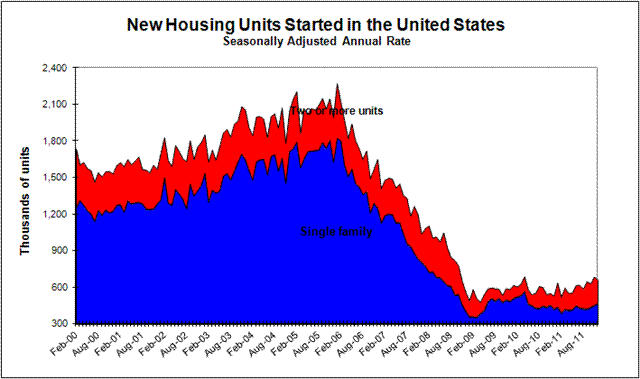
The key metric that most economists and CE industry experts watch is single-family housing starts – the raw count of the number of single family dwellings upon which construction has begun (or “started”). Peaking in 2005 at over 1.7 million units , housing starts began a multi-year slide, with a slope too scary to sled down – let alone live through.
 Last year, 430,600 single family homes were started. If you think this sounds like a low amount of activity, you’d be right – this is the lowest level of residential housing construction since the government began compiling statistics in 1959.
Data looks bad, but look again…
Yesterday, the U.S. Department of Commerce released the data through February and on the face of it, the news looks bad. Single-family starts for the month were at a rate of 457,000 units or 9.9% lower than January’s revised rate of 507,000.
However, the February rate was 17.8% higher than February 2011’s rate of 388,000 units. And when overall starts (including multi-unit construction) are considered, the rate of increase jumps to 34.7% as compared to February 2011.
This stat predicts the future…
But what really has analysts talking is a less-followed housing market statistic. Before you can start building a home, you have to get a permit from local authorities to do so. Permits, also tracked by the government, are reported at the same time in the same report that starts are, even though most people overlook it.
It’s going to be a little harder to overlook permits in the February report – they increased a full 5.1% over the rate in January and 34.3% over the rate in February 2011. Builders received 717,000 permits – the highest rate of permits issued since October 2008 according to the New York Times.
Rehab takes time…
The Times said that economists had expected a robust rate of 690,000 units, but the actual rate exceeded even this optimistic forecast. Some economists are suggesting that this is a sure sign of a housing industry rebound.
“The data provides further evidence of a rebound in housing activity,” Eric Green (no relation to ALERT Editor Ted Green), chief economist of TD Securities told the Times. “Housing is being nursed back to health, but getting out of rehab takes time.”
BLAM, a dramatic turn of events…
But before analysts could celebrate, the National Association of Realtors rained on their parade. In new data released by the NAR today, sales of existing homes unexpectedly dropped just under 1% to an annual rate of 4.59 million units. Economists were wrong again, but this time the actual numbers came in less than their anticipated 4.62 million units. Wall Street reacted to the news with broad declines in mid-afternoon trading.
Still, even that bad news was slightly offset by the fact that the NAR had revised the January figures up which Reuters said could indicate that the housing market was at least stabilizing. Also, while the February rate was .9% below the January rate, it was 8.8% over the year earlier rate of February 2011.
Clouds still look a little dark…
“We are seeing some signs of stability in pricing,” Gary Thayer, chief macro strategist of Wells Fargo Advisors told Reuters.
One dark cloud that doesn’t seem to want to go away is the inventory of unsold homes. Reuters noted that “the housing market continues to be choked by a glut of unsold properties, which are weighing down prices.”
Sales down means inventory up…
The NAR report stoked those concerns showing that there was a 4.3% increase in the number of unsold homes to 2.43 million units in February. When February’s rate of sale is applied to this level of existing inventory, then it represents about a 6.4 month supply.
This is well over the less-than-six months supply that many economists consider healthy. It also is a significant increase over January’s supply of 6.0 months.
So housing market data is mixed and this is good news. We may not have a boom anytime soon…but the bust appears to be over and housing – much like the overall economy – will slowly get back on track.
“A critical question is whether sales are set to take off soon, given the improving economy,” Patrick Newport, an economist with IHS Global Insight told Reuters. “Our view is that sales will continue to improve, but unless credit conditions loosen significantly, a takeoff will not take place.”


Leave a Reply