As the economy continues to show more signs of a slowdown, we can’t help but notice increasing volatility in the month-to-month readings of various statistics. The latest government data on housing construction starts is a great example of this. After a big jump in August, starts dropped in September by 9.4% – a larger than normal amount – from the revised rate in August.
See the surprising slump in housing starts…
In August, housing starts performed a surprising surge, jumping a huge 12.3% to 1.364 million units on a seasonally adjusted annual rate. This was the highest rate of housing construction since 2007. No one knew quite what to make of that. Most reports suggested that the main reason for the jump was the continued low mortgage rates stimulating demand.
The month before, July, had shown a decline in starts to 1.215 million units…with shortages of land and labor blamed for the decline. Then the big jump in August…
September Starts Off 9.4%
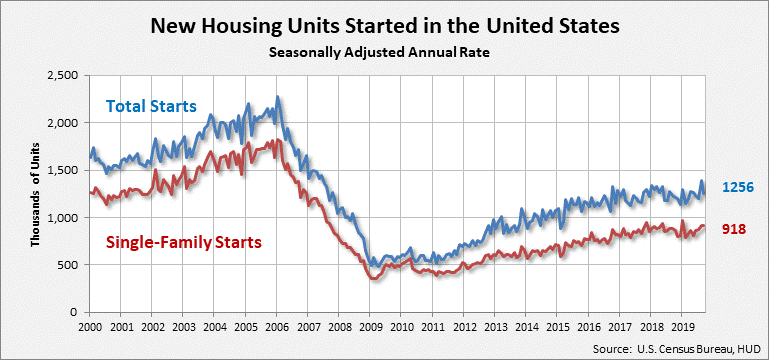
In September, housing construction fell to a rate of 1.256 million or 9.4% below the revise August rate of 1.386 million units. However, this rate remains slightly above (+1.6%) the 1.236 million rate of September 2018.

The sub-category single-family housing starts in September came in at 918,000 units. This is essentially flat (up just 0.3%) with the 915,000 units in August. In my opinion, single-family housing construction is the statistic that is most meaningful to the custom integration industry.
All Three Major Indexes Fell
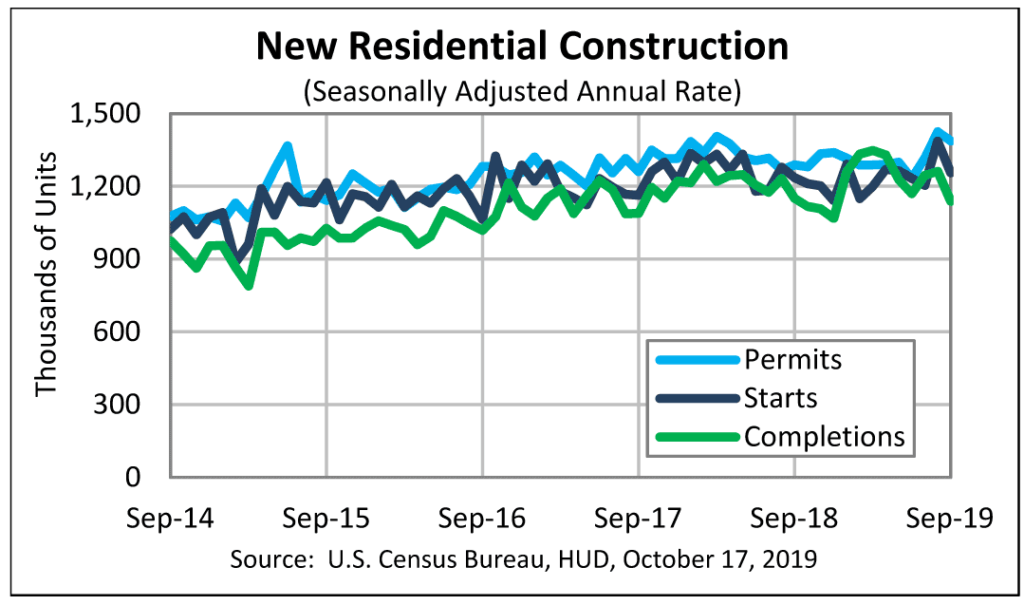
It is notable in this month’s report from the government that all three major measures of the health of the housing construction segment – a major indicator on the health of the overall economy – showed declines. This includes not only starts (-9.4%), but permits (-2.7%), and housing completions (-9.7%).
Particularly in the case of permits index, this decline can be concerning, as the permits reading is considered to be a leading indicator of where the market is headed. In this case, that suggests the market is headed yet lower.

All Major Regions Saw Construction Decline
All four geographic regions showed declines in housing starts. The worst case was the Northeast, with a stunning 34.3% decline. This was followed by the Midwest, which showed a 18.9% drop in housing starts. After these came the South, at a 4% drop, and finally the West with a more modest 1.9% decline.
Economic data is getting increasingly volatile which, in and of itself, suggests some kind of major change is coming.


Leave a Reply