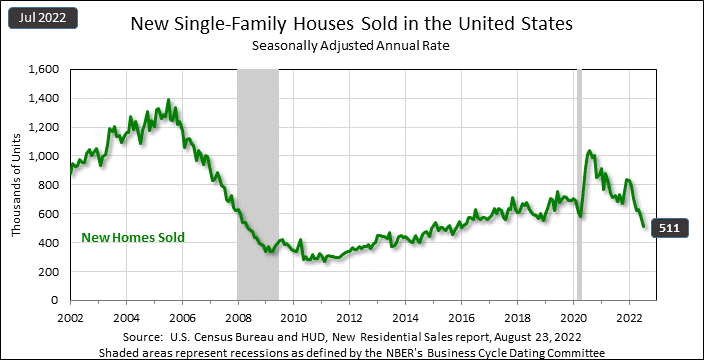
The U.S. Census Bureau and the U.S. Department of Housing and Urban Development jointly released the latest housing data this week showing that sales of new single-family homes in July hit their lowest level in 6½ years. While unit sales declined, both median and average prices continued to increase, making future home sales even more unaffordable.
See more details on new single-family home sales in July
In a sobering confirmation of a housing market in recession, the latest government data shows that sales of newly constructed single-family homes in July were at a seasonally adjusted annual rate of just 511,000 units. This rate is -12.6% lower than the revised June rate of 585,000 units and -29.6% lower than the 726,000 units sold in July 2021.
Not only that but as mentioned above July’s rate is also the lowest rate of sales of new single-family homes since January 2016 or in 6½ years. According to Reuters, sales of newly constructed homes represents about 9.6% of the total home market and is a key statistic that economists watch for any changes in trends.
A More Modest Decline was Expected
Reuters reported that economists were expecting a decline in unit sales, but not one as steep as this. Economists polled by the news organization had forecast that unit sales would decline to a more moderate 575,000 units
A part of why housing is in decline is due to the Federal Reserve Board’s rapidly tightening fiscal policy, which is driving up interest rates on mortgages and impacting housing affordability. Another factor is the continued rise in home prices – and that statistic was also emphasized in this new report.

Despite Sales Decline, Housing Prices Continue to Rise
According to the new data, the median price of a home sold in July was $439,400. This was a +8.2% increase in cost on a year-over-year basis. Perhaps even more impressively, the average price of a new home sold in July was $546,800 – a walloping +18.33% on a year-over-year basis.
The Fed is getting what it wants. The housing market needed to cool, and higher interest rates were the only thing that was going to accomplish that.
Matthew Walsh, an economist for Moody’s Analytics to Reuters
As a result of the sales decline, the “Month’s Supply” of homes available for sale increased almost 18½% from 9.2-months supply in June to 10.9-months supply in July. This means at the current rate of sale, it would take almost 11 months to work through the available supply of homes.
Sales-adjusted inventory levels are at an elevated 10.9-month supply in July. However, only 45,000 of the new-home inventory is completed and ready to occupy. This count has been rising in recent months and is up 40.6% compared to a year ago. New-home sales are likely to continue to show weakness in the months ahead (emphasis added).
NAHB Chief Economist Robert Dietz
Regional Results Show Fairly Even Impact
On a regional basis, month-over-month new home sales dropped by double-digits in three out of the four major regions. Only the Northeast was spared, with new home sales increasing by +13.3% in July. The other regions were as follows: Midwest -20.6%…South -12.1%…and West -13.3%.
Sales of new single-family homes in all regions declined well into double-digits on a year-over-year basis, with the West seeing the greatest decline of -50.3%.


Leave a Reply