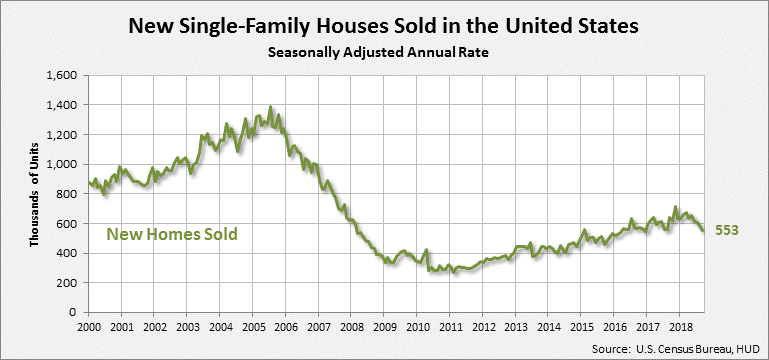
 Recently, I warned of some troubling housing related news. You may recall that a collapse in the housing sector was a key driver of the last recession in 2007-2009 that was so painful for the custom integration community, and for the country as a whole. In my report – Are You Prepared for the Coming Recession? – I noted a pronounced and troubling turn in several housing industry specific data, perhaps presaging another economic downturn. Now new government data shows that, once again, new residential sales have declined in the month of September.
See more on residential sales turning downward…
In new data from the U.S. Census Bureau and the U.S. Department of Housing and Urban Development, sales of new single-family houses in September were at a seasonally adjusted annual rate (SAAR) of 553,000 units. This rate is fully 5.5% below the August rate of 585,000 units and a troubling 13.2% below the rate of sales in September 2017 or one year ago.
Also concerning is the fact that the government had to revise downward the originally announced rate for August. This in and of itself is not that unusual, but this time it was a fairly significant 7% downward revision, from the originally reported 629,000 units to the revised rate of 585,000 units. Not only is that level of adjustment fairly large, it also recharacterizes last month’s report from a bump UP in sales, to a DECLINE in sales for August…now followed by a further decline in September.

The Cause for Concern
Are you beginning to get a sense of the reason for the cause of concern?
It is also worthwhile to consider a change in the reported median and average home prices included in this report. In August, the median sales price of a new house was $320,200. In September, this new report places the median home price at $320,000, down slightly from the previous month…but down nonetheless. Prices had been increasing pretty steadily earlier in the year.
Similarly, the average sales price of a home sold in August was listed as $388,400. In September, this average price dropped to $377,200.
Inventories of Homes for Sale Increase
Inventory levels of homes available for sale, which has been considered restrictive and one of the culprits driving up home sales prices – was listed as 318,000 units or a 6.1-month supply. But in September, this level of available inventory of new homes actually rose to 327,000 units or a 7.1-month supply. Again these numbers can bounce up or down, but to shift a full month of added supply is a pretty significant shift.
Looking at the data on a regional basis you will find that only one of the four major regions showed an increase in new home sales – a 6.9% increase in the Midwest. All of the other regions showed declines, including the South, down -1.5%; the West, down a significant double-digits, off -12.0%; and the Northeast, off a shocking -40.6%.
Not the Only Concerning Data
Of course, data on new residential sales is only one economic indicator of the overall health of the housing sector. But if you read my full report, you’ll see there are other housing sector data points taking troubling turns as well.
When the economy is good, it can seem silly to worry about downturns. But certainly one of the lessons of the last recession that some of us learned is that it pays to stay vigilant, especially when things seem the strongest…


Leave a Reply