 As is their normal practice, CEDIA released selected results from their 2016 Size and Scope of the Residential Electronic Systems Market survey in their booth during CEDIA 2016. The presentation this year, like last year, was made by Dave Pedigo. However, unlike last year, this year Pedigo has been put in charge of market research, a post that has been open since Erica Shonkweiler left some time ago.
Last year, we reported on the some of the surprising results from the survey. Some of those results were so surprising, they were unbelievable – and even Pedigo agreed with us that some didn’t appear proper. This year? Some of the results, if accurate, could be troubling.
See the results CEDIA shared with members at CEDIA 2016…
First launched in 2011 as the brainchild of then-CEO Utz Baldwin, CEDIA’s Size and Scope Survey represented the only available data to assist members and vendor marketers in planning their businesses. It wasn’t perfect, but it was better than nothing.
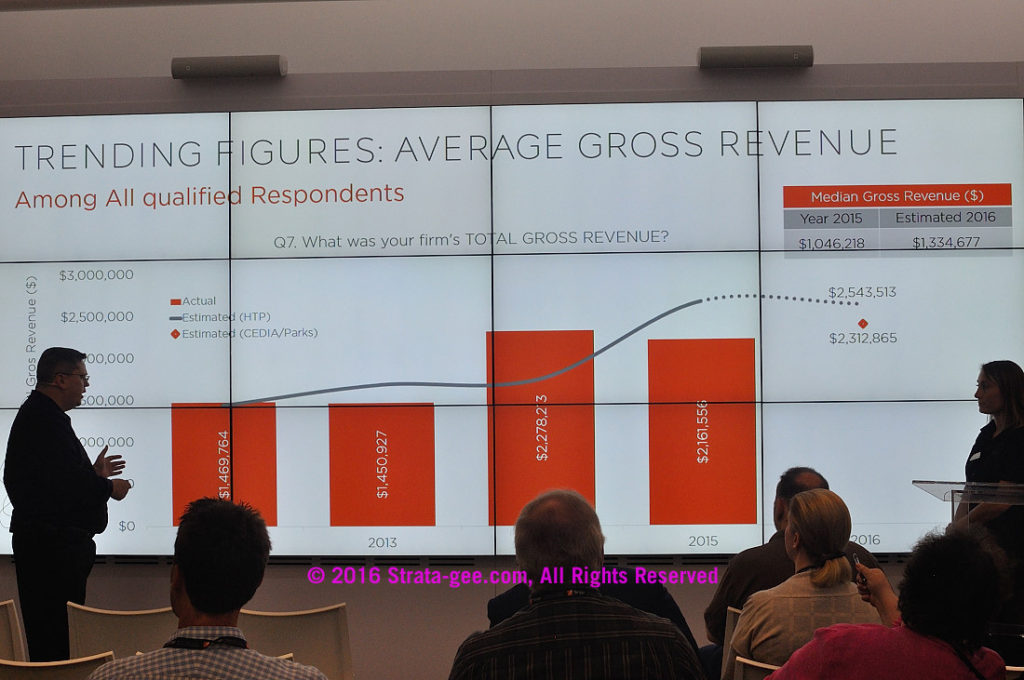
Last year, we pointed out that some of the data appeared incorrect. In particular, we noted that CEDIA reported that average annual total revenues for integrators rose 50% in just one year – from $1.459 million in 2013 to $2.2 million in 2014.
Some Questionable Results Last Year
 Not only that, but the organization forecast that for the period of 2012 to 2015, average annual total revenues for integrators will have doubled. These numbers just did not jive with what integrators were telling us. Most integrators said they saw modest increases during that period of time, but certainly nothing approaching 50% from 2013 to 2014…or a doubling from 2012 to 2015.
So how about this year?
Pedigo noted that about 653 dealers participated in the survey this year, a number he was comfortable represented a low margin of error for the most part. However, depending on the question, this number can drop to potentially unreliable levels as not every dealer answers every question.
A ‘Newsworthy Slide’ – Integrators Average Revenue Declined in 2015
We began with an update on the average total revenue for integrators – a topic that Pedigo introduced with: “Now this is actually kind of a newsworthy slide if you don’t take the nuance into it,” Pedigo started. “Meaning that, right now we have estimated that the size of the industry – the average gross revenues for our members actually slightly declined in 2015 as compared to 2014.”
Look Back to Find Growth
Pedigo mentioned that in his opinion, this was not bad news – suggesting that in 2014 “a lot of pent up energy, pent up demand was released. And so, when we look at 2015 – even though 2015 was a little bit of a step back in average gross revenues – it was 27% or 37% above the 2013 level.”
Pedigo called it “tremendous growth over a two-year period.”
So in other words, CEDIA believes that 2015 was a correction from the unbelievable growth in 2014. We’re not so sure. Had we received independent confirmation from integrators last year of that spectacular growth rate, then maybe. But we didn’t.
In the chart above, you see a gray line which represents the integrators projections for each year. Normally, as even Pedigo noted, these estimates are high – the real final number is almost always lower than integrators (whom Pedigo called ‘an optimistic bunch’) estimated. But in 2014, the reported “real” number was way above the projection. We’ve never seen this before…ever. And it forces us to question last year’s survey.
Forecasting a Strong 2016
In any event, integrators are projecting that their average gross revenues in 2016 will come in at $2,543,513. Even CEDIA saw the need to tamp this forecast down to a more realistic growth estimate, as Pedigo noted that “traditionally” integrators over-estimate their revenues by about 15%. So for 2016, CEDIA is forecasting a more realistic number is $2,312,865 for a 7% increase over last year. This more realistic number was rather arbitrarily chosen by cutting the percentage of forecasted growth from the integrators in half.
Moving on to the breakdown of the integrator’s business, Pedigo noted that members reported that about 75% of their revenues come from residential installations. This number has remained remarkably stable for several years now. The rest is predominantly light commercial.
Average Number of Installations Dropped as Well
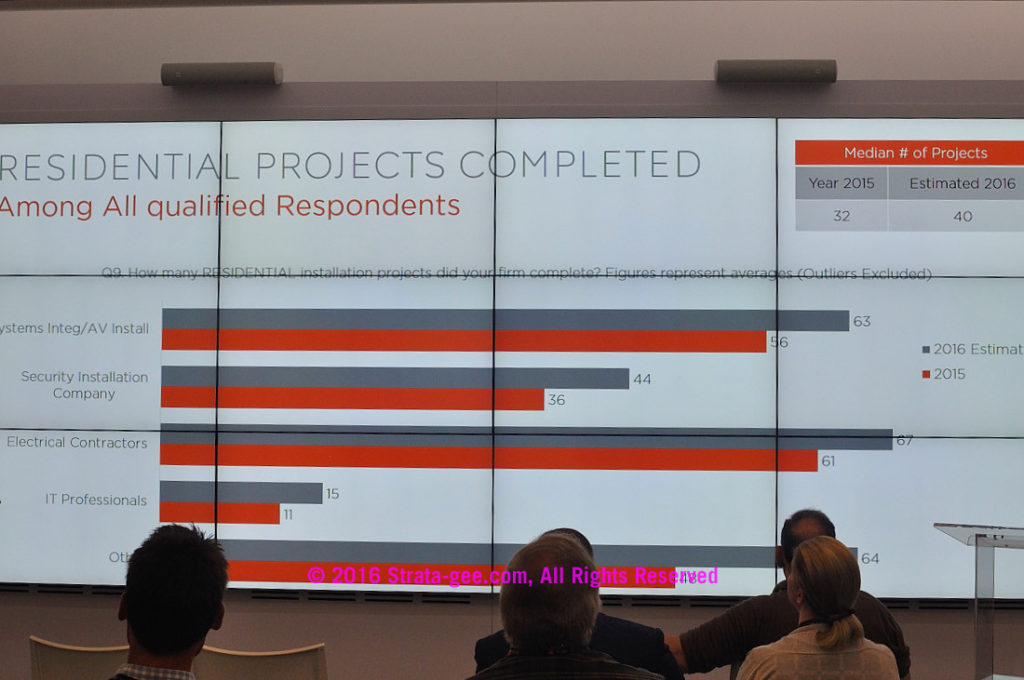
When looking at the average number of installations completed by members, we were surprised to see this number drop as well. This corroborates the overall revenue decline experienced by members over the last year.
In a chart showing the number of jobs competed across different types of installation companies (system integrator/av installer, security installation company, electrical contractor, IT professional, “others”), system integrators reported that they completed 56 installations in 2015. This number is 5% below the 59 jobs they completed in 2014 and more than 15% below the 66 installations they projected they would complete.
Balancing Equipment and Labor Revenues
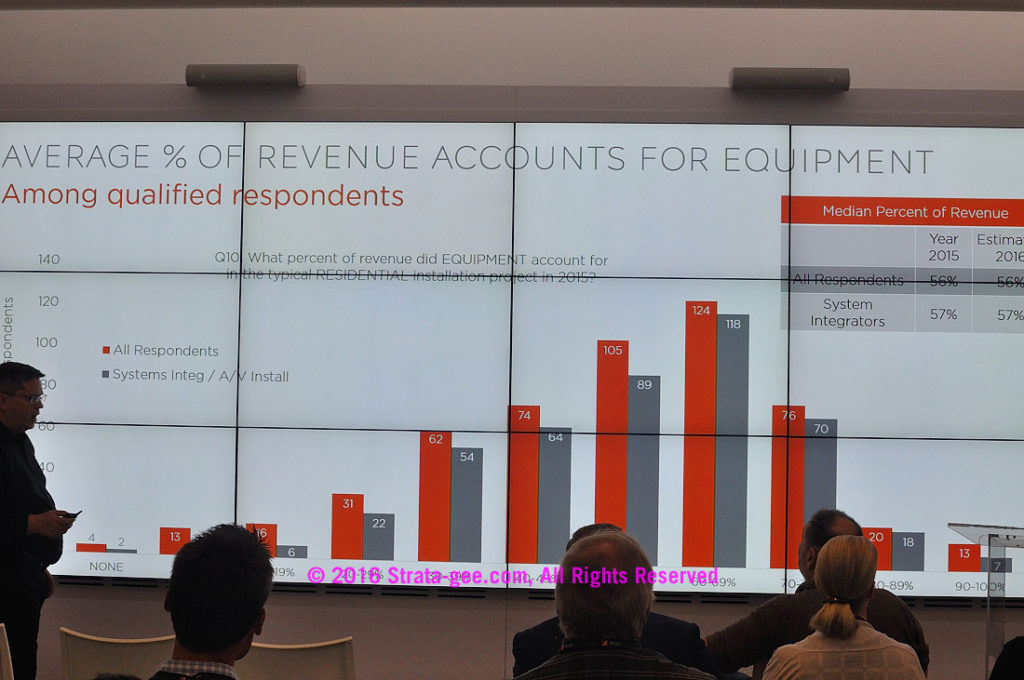
Pedigo next discussed a slide showing the percent of the integrator’s revenues coming from equipment sales. In general, he told the group that integrators should not be overly reliant on equipment sales, or they will be vulnerable if a new disruptive product trend comes through and ruins their profitability. According to Pedigo, the “right number” is around 50% of your total revenues should come from equipment sales…above that and your business is at risk.
Average Home Theater/Media Room Revenue
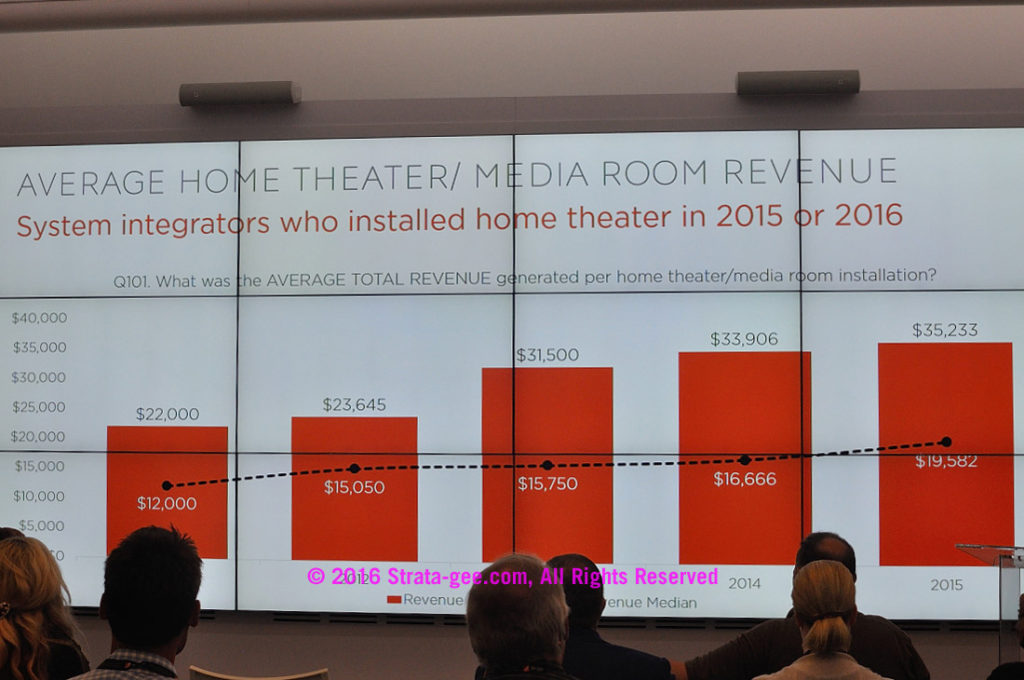
Pedigo hailed a result that he suggested showed the health of the industry – the average revenue from a home theater/media room installation. According to the data, both the average and the median revenues from home theater installations have increased each year for five years running.
[Click to enlarge]
Audio Installations?
So how did audio installations fare? According to the survey results the number of audio installations actually declined from 2014 to 2015, from 34 to 30 respectively.
One member of the audience suggested that this reduction of audio installations is due to the influence of Sonos.
Control System Installations
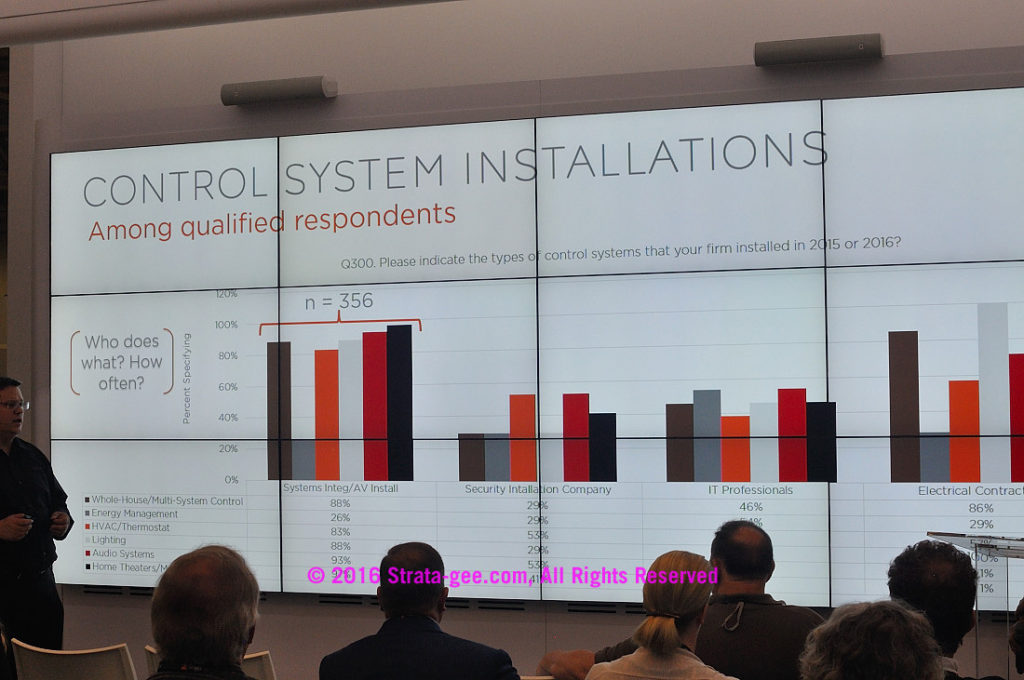
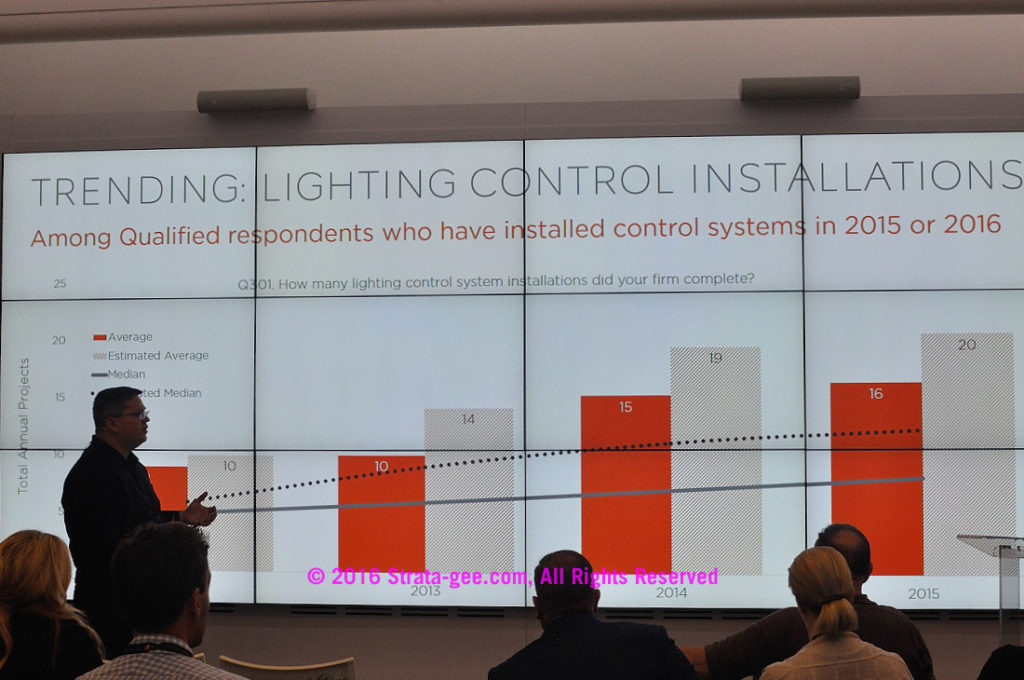
In looking at control system installations – by type of installer, Pedigo put up a rather complicated slide densely packed with data. However, if you focus on systems integrators/AV installers you see somewhat predictable responses.
[Click to enlarge]
[Click to enlarge]
Pedigo: ‘That, to Me, is Troubling’
After looking at security system installations, Pedigo turned to home network installations. And it was on this result that Pedigo said, “That, to me, is troubling.” In particular, the survey results said that the average number of home network installations have declined from 36 installations on average in 2014 – to 30 installations in 2015.
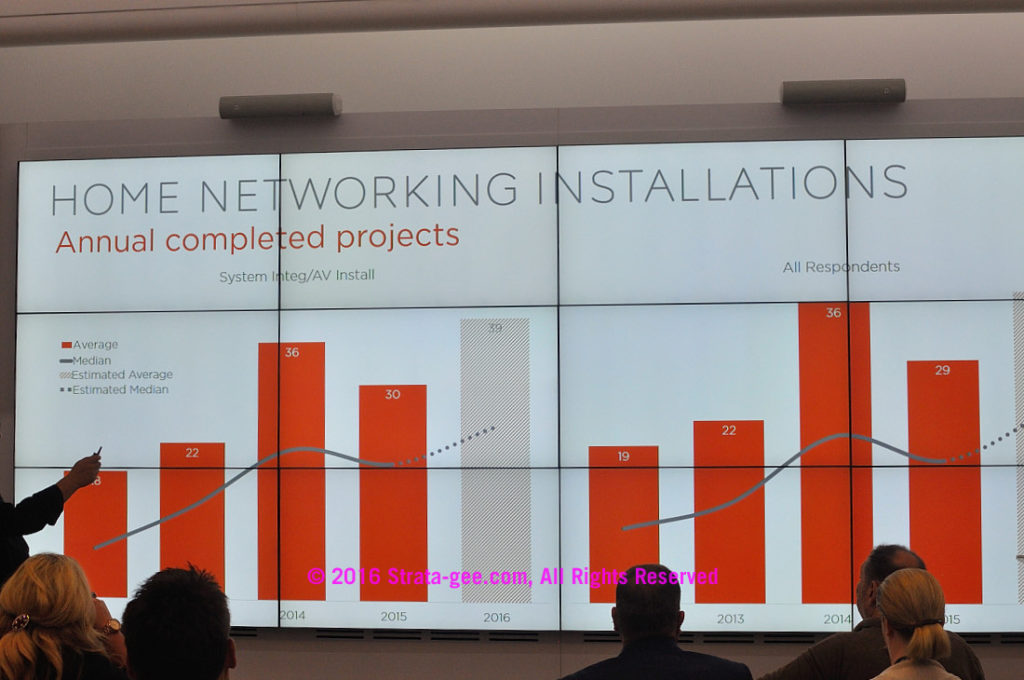
Pedigo believes that integrator are running into homeowners who say they’ll just put in their own wireless router. But this is a mistake the CEDIA executive said, “A router is not a router is not a router.” Pedigo was making the point of how mission critical to today’s system installations the home network is. Integrators, he says, have to do a better job of selling the homeowner on a professionally installed, structurally robust home networking system.
“People [integrators] are scared to tell somebody [the client] that they need to buy a $1,000 router,” Pedigo postulated. “Sorry, this is the central nervous system of the home and you need to do a better job of selling networks.”
CEDIA members who would like to learn more about the industry data that the organization collects can reach out to: research@cedia.org.
For those who would like to learn more about the information, education, and services offered by the organization, visit: www.cedia.net.




Leave a Reply