Just Two Charts Tell the Story of the Housing Market
For some time now, I have been dutifully reporting on the – at first subtle…now as subtle as a Mac truck – changes taking place in the housing market, clearly in decline after a stunning runup during the 2020-2021 COVID period. Certain economic segments, including Tech in general and custom integration specifically, benefitted from the COVID period forcing consumers to huddle in their homes.
But now, things are changing, starting with the housing market…
I recently ran across a couple of stunning charts that I think clearly demonstrate what is happening in housing, and why that segment is in decline. Given that housing is a significant contributor to the U.S. GDP, as well as a massive driver of business in our industry, I watch developments there pretty closely.
The first chart I’d like to show you is based on data maintained by the Federal Housing Finance Agency (FHFA) known as their Housing Price Index (HPI). The housing price index has existed for decades and it monitors changes in single-family home values. It is a broad measure that tracks closely those changes and it is carefully monitored by economists looking for trends spanning over the decades.
The ‘Blazing Inferno’ of the Housing Market
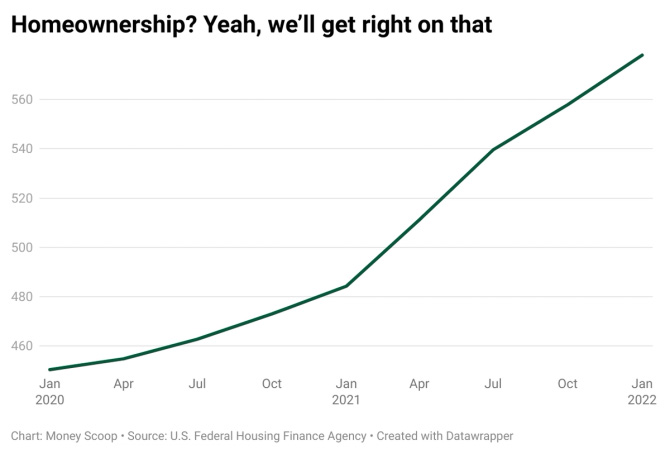
The chart shown below was created by the Money Scoop newsletter from FHFA HPI data. They call it their “Extremely Ominous Chart™.” Incidentally, the editors at Money Scoop do not mince words when they discuss the state of today’s housing market, or as they put it – “…the blazing inferno that is the 2022 housing market.”
This chart is based on data from the agency tracking the dramatic runup in single-family home values. Pay careful attention, not just to the actual numerical figures representing the increase in home values but especially note the mind-blowing rate of this runup over the last year.
Someone Hit the Afterburners
As you can see, home values began to rise noticeably during the second quarter of 2022, in the wake of the rollout of the COVID-19 pandemic. One of the unanticipated consequences of the pandemic is that a large number of folks living in metro areas decided to move to more expansive, less crowded suburban or rural areas – fueling massive demand for homes. And as we all know, a basic law of economics is that an increase in demand = an increase in home values. This runup in values continued throughout 2020 at a pretty brisk clip. But when we hit 2021 it looks like someone hit the afterburners, as housing values really took off!
I have viewed a longer-term version of this chart that goes all the way back to January 1991 (they have data back to the 1970s!) and I find no comparable period of such rapid value inflation as we experienced in 2021. And now, 2022! The latest data from FHFA shows that home values in May 2022 were up 18.3% over the values experienced in May 2021. Housing prices are still rising at a double-digit clip. Yikes!
Housing Values UP = Home Affordability DOWN
These historically high housing values are making homes less affordable for an expanding class of potential home buyers. But let’s check out that other chart.
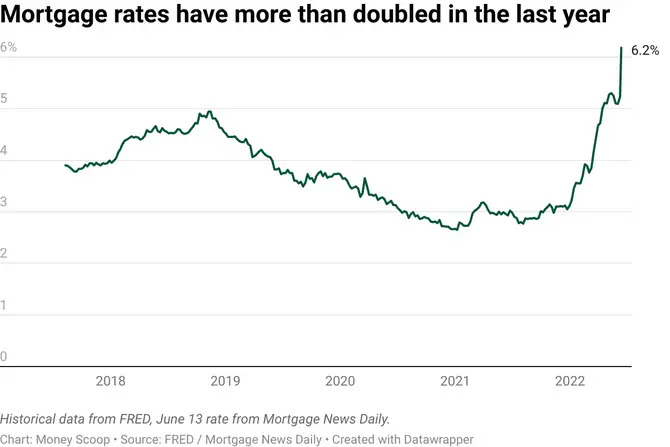
The other factor impacting the housing market is mortgage rates. The fact is that most consumers purchase homes with help from their bank or a mortgage company in the form of a 15- or 30-year mortgage. These loans carry an interest rate that for some time now have been at historical lows. But that’s all changed now.
Mortgage Rates have Skyrocketed
As you can see by this chart, also from Money Scoop, mortgage rates in 2022 have skyrocketed – essentially doubling in a matter of just a few months. This is largely due to the fact that the Federal Reserve Board is raising bank rates in order to fight inflation – which itself is at 40-year highs.
Just look at that rate of increase on mortgage interest. It is obviously much higher than the low rates in early 2021. But it is even substantially higher than the pre-COVID period of 2018/2019.
Just Two Charts Tells the Story
So there you have it. In just two charts – the Housing Price Index…and Mortgage Rates – it is like an uppercut to the jaw followed by a roundhouse punch to the face. In other words, a knockout for most homebuyers today.


Leave a Reply